Tutorial 3: Mapping Deforestation in South Andaman Island Using Vyom#
Tutorial by
Sourabh Motiani¹, Utpal Singh², Satyam Pratap Singh²
¹ Department of Earth Sciences, Indian Institute of Technology Roorkee
² School of Geosciences, University of Sydney
This tutorial demonstrates how to map deforestation in the South Andaman region using Kalpa. We will use the vyom plugin to calculate the Normalized Difference Vegetation Index (NDVI) from satellite data.
Workflow#
Step 1: Create a Bounding Box#
Start by creating a bounding box of the region.
Navigate to Tools → Vector → Bounding Box.
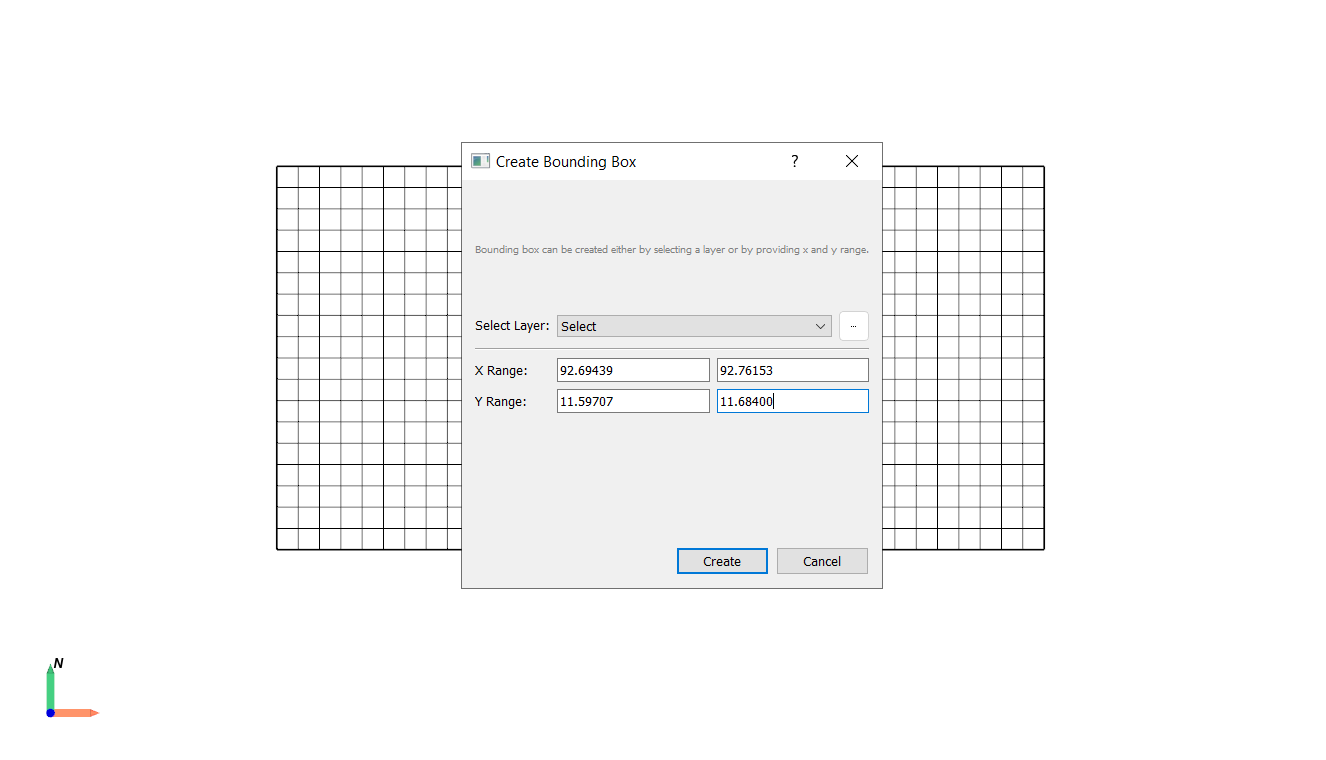
Set the X and Y range for the South Andaman region.
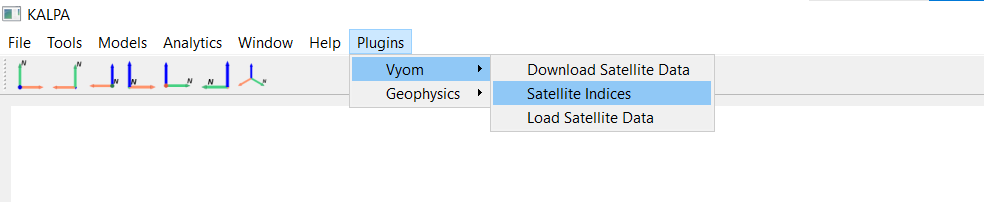
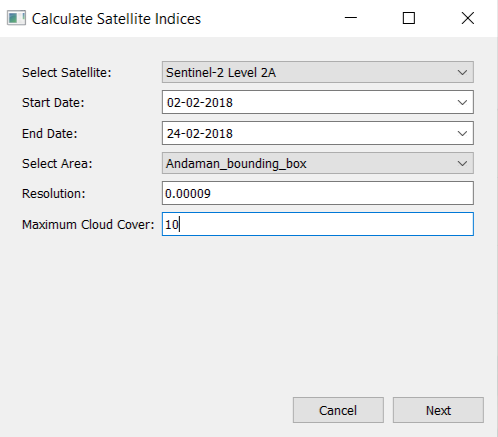
Step 2: Download Satellite Data and Calculate NDVI Using Vyom#
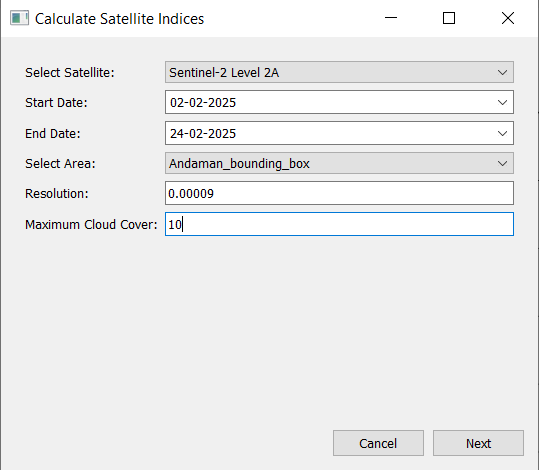
Navigate to Plugins → Vyom → Satellite Indices.
Select the satellite and enter the time period for which data is required.
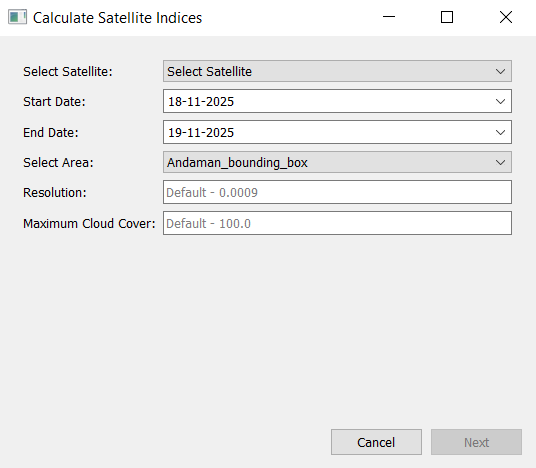
Select the resolution and maximum percentage of cloud cover for the data to be downloaded.
Click Next.
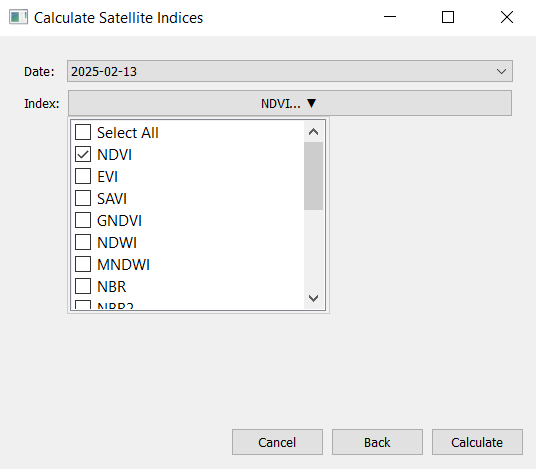
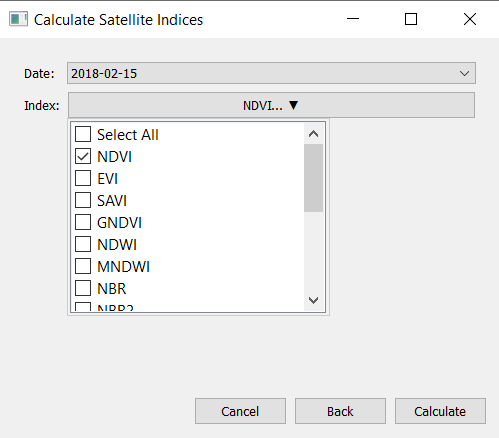
Choose from the available dates within the selected time period and select the NDVI index.
Click Calculate.
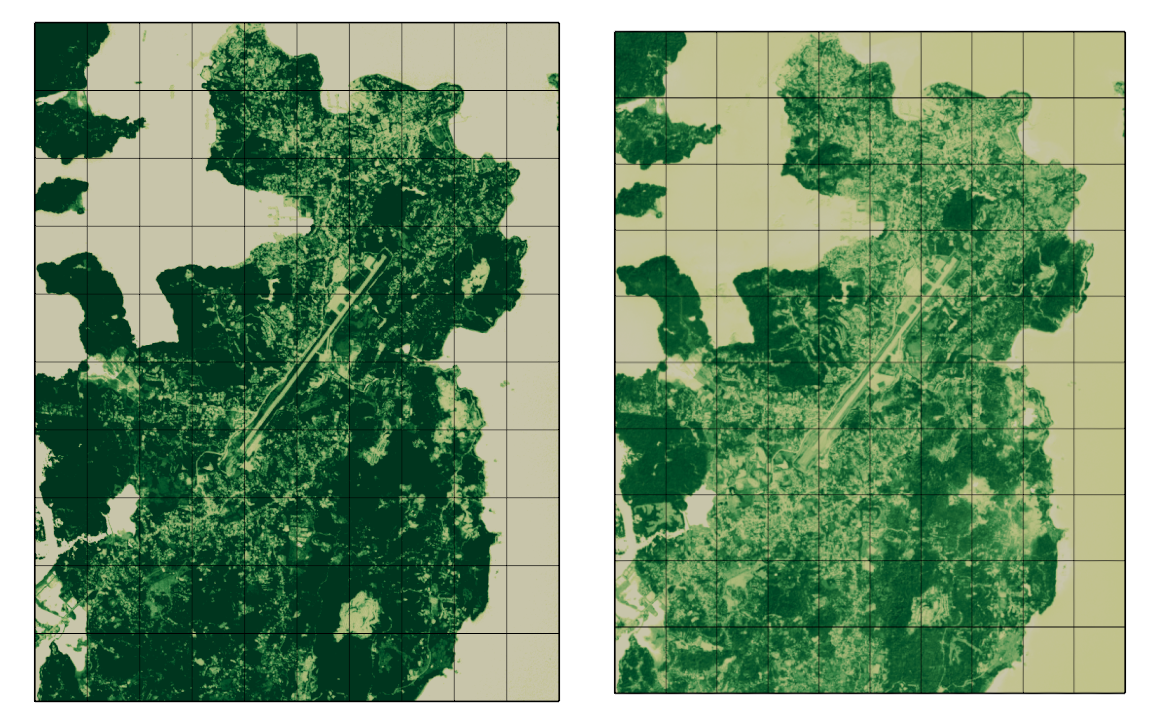
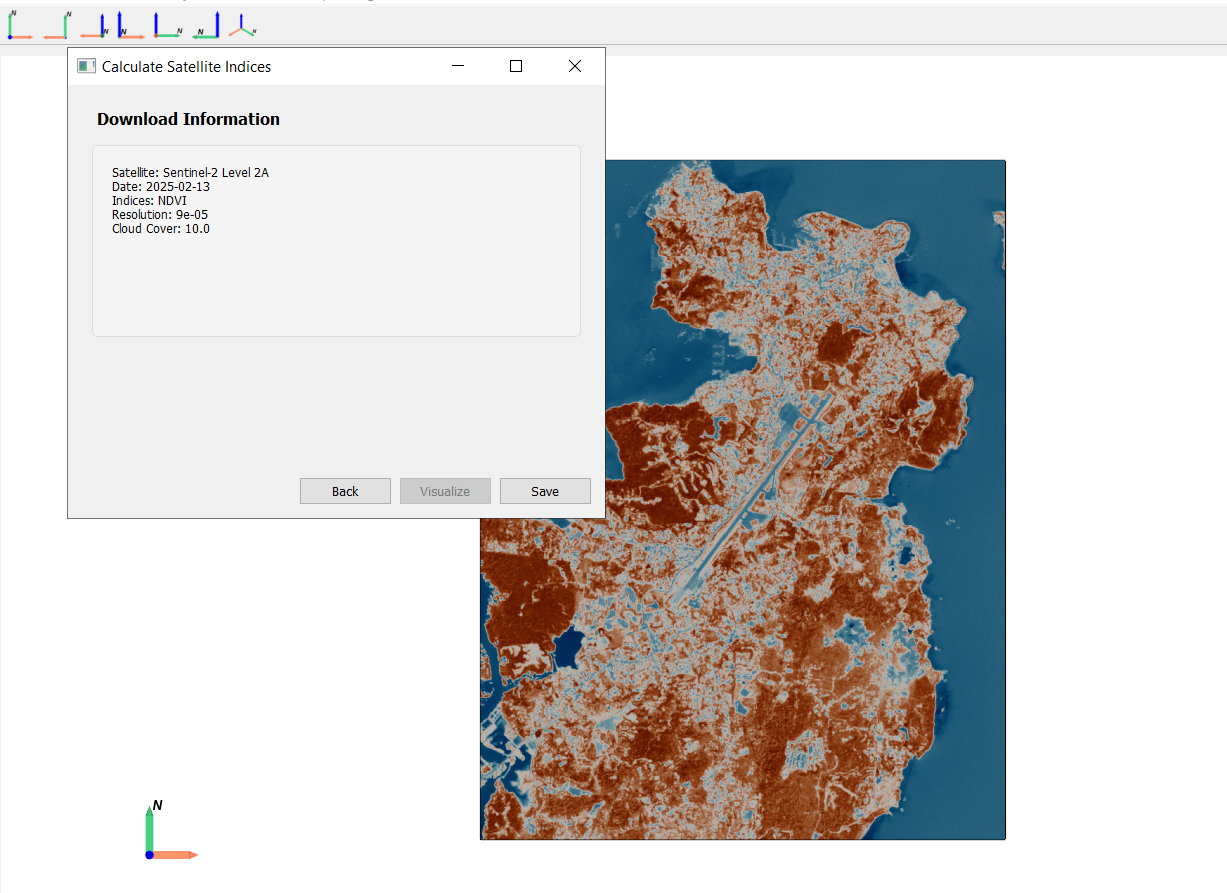
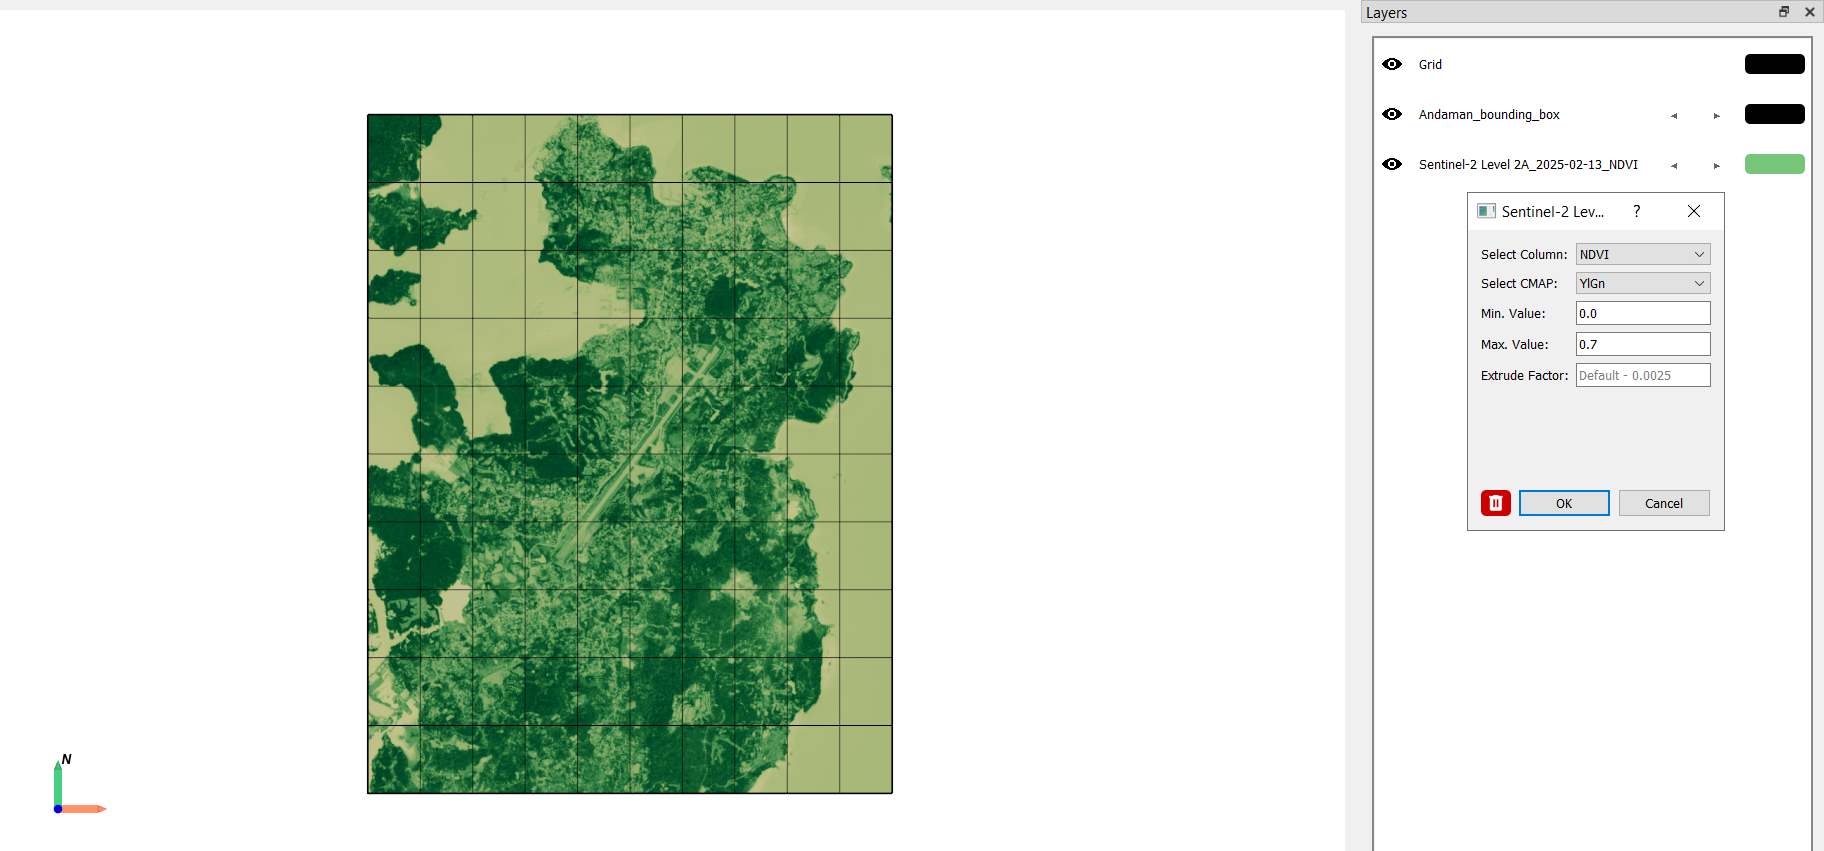
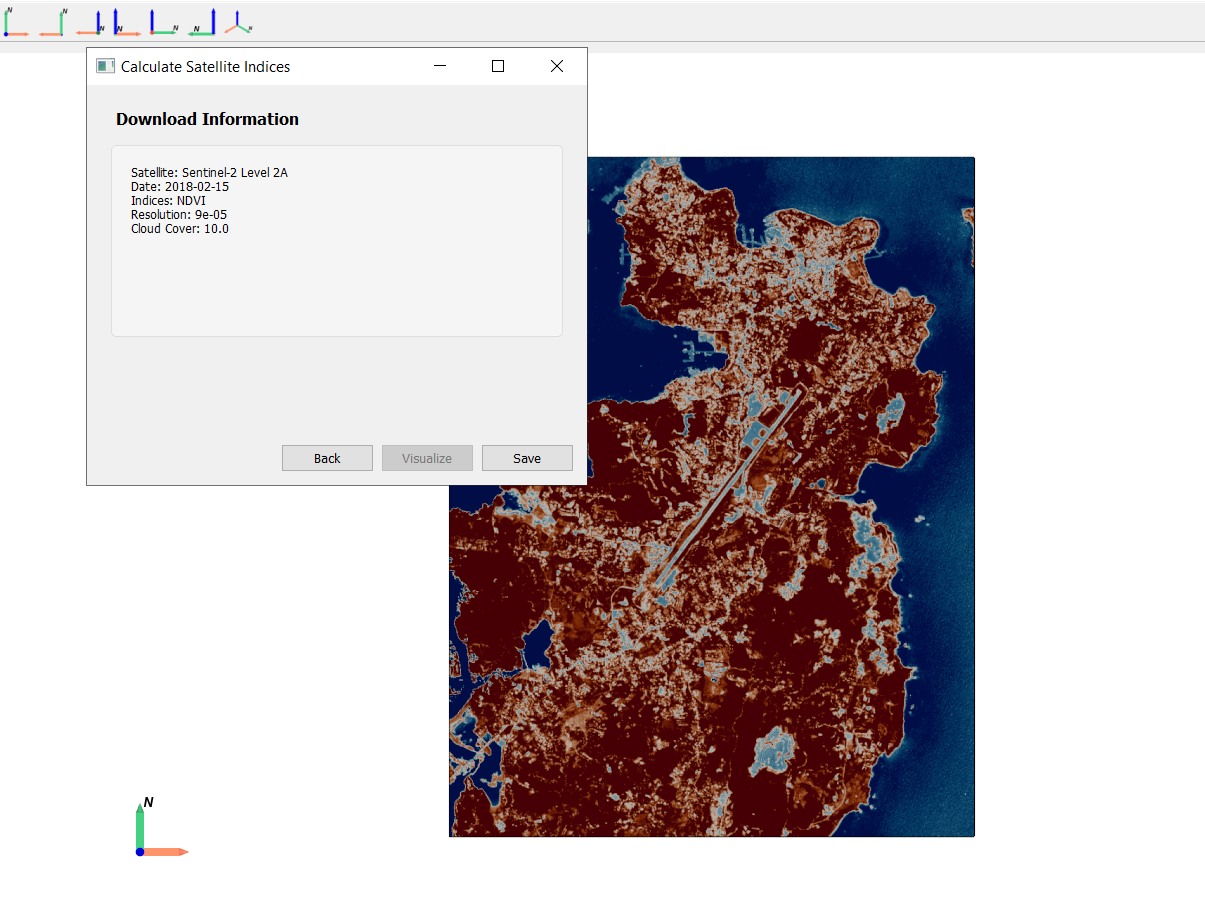
Visualize and save the NDVI raster for the year 2025.
Repeat the process to calculate the NDVI for the year 2018.
Visualize and save the NDVI raster for the year 2018.
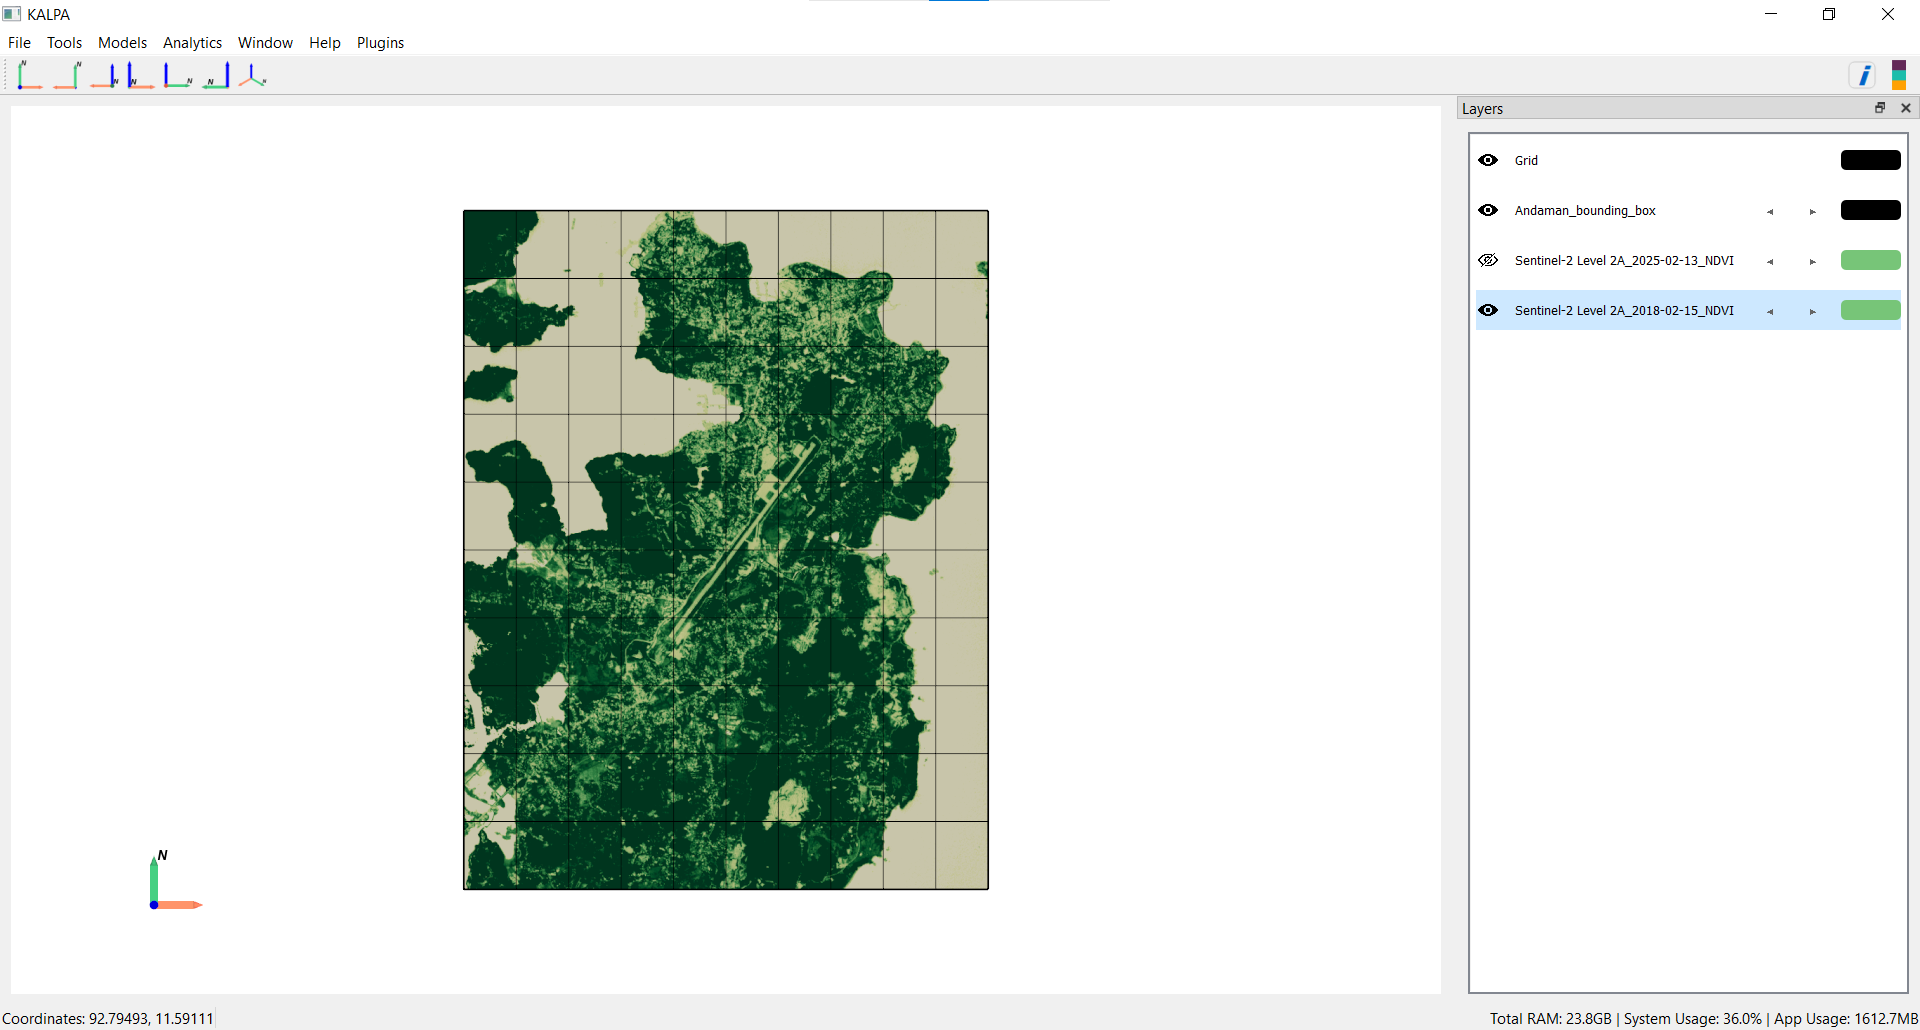
Step 3: Change Detection#
Compare the two NDVI layers to identify regions of vegetation loss.