Tutorial 4: Monitoring Crop Health in Wimmera, Victoria with Sentinel-2 and NDVI#
Tutorial by
Utpal Singh¹, Satyam Pratap Singh¹, Sourabh Motiani²
¹ School of Geosciences, University of Sydney
² Department of Earth Sciences, Indian Institute of Technology Roorkee
This tutorial demonstrates how to monitor crop health in the Wimmera region of Victoria using Kalpa. We will use the vyom plugin to download satellite data and use kalpa’s Data Sampling and Vector Calculator to compute the Normalized Difference Vegetation Index (NDVI) from satellite data.
Dataset Overview#
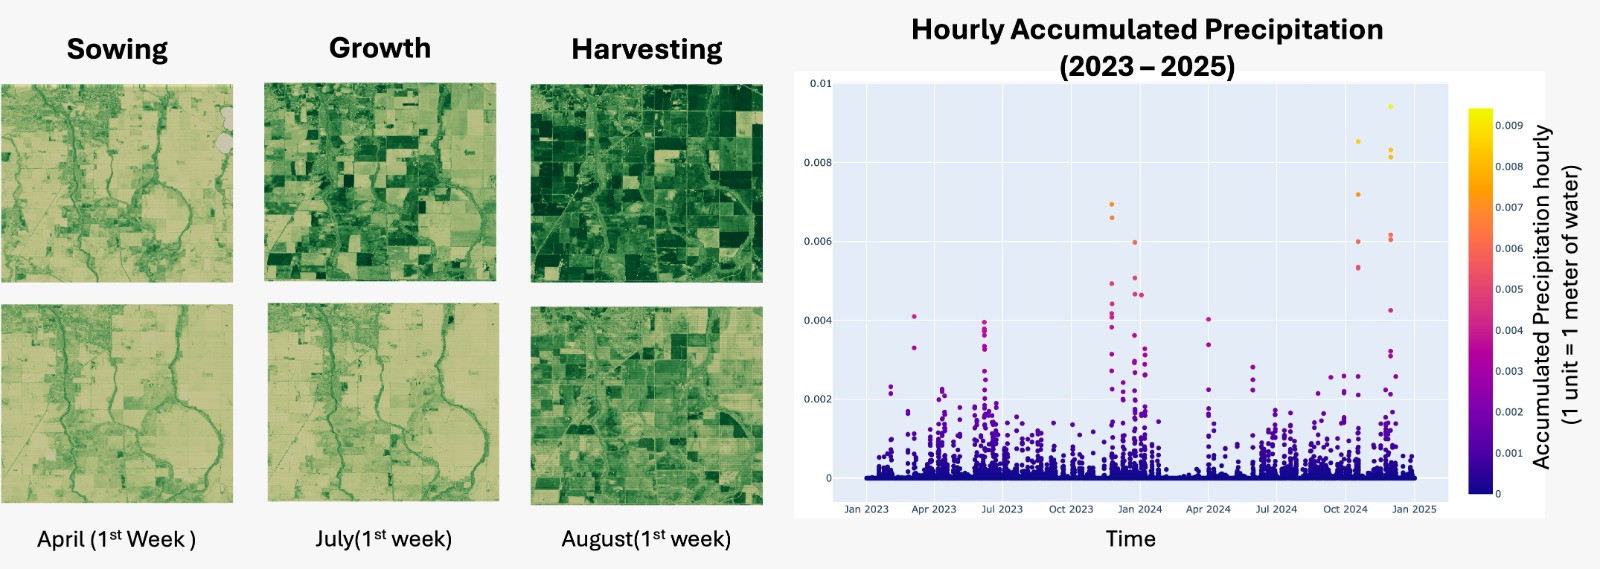
For this task, we use: Sentinel-2 Bands: Multispectral bands (4 and 8) for the duration of April to August for year 2023 and 2024.
Workflow#
Step 1: Create a Bounding Box#
Start by creating a bounding box of the region.
Navigate to Tools → Vector → Bounding Box.
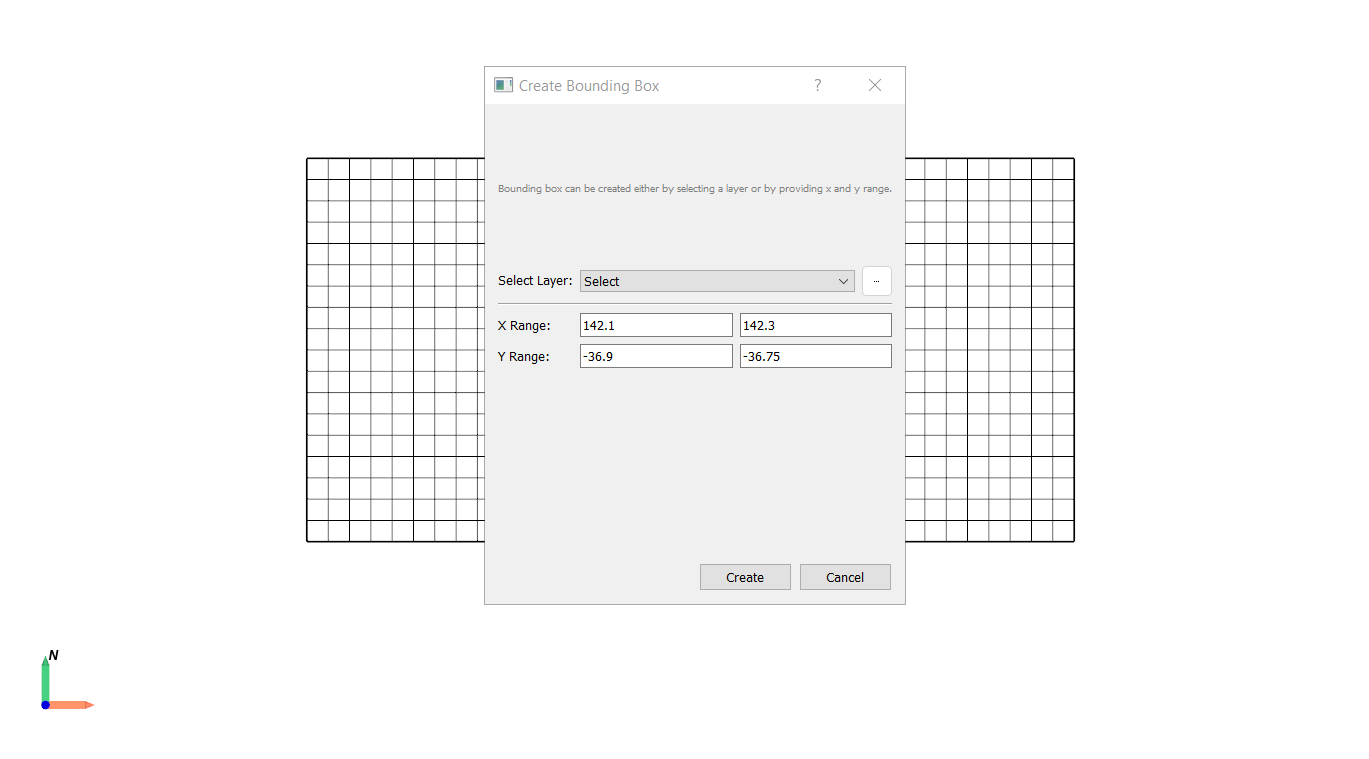
Set the X and Y range for the Wimmera region in Victoria.
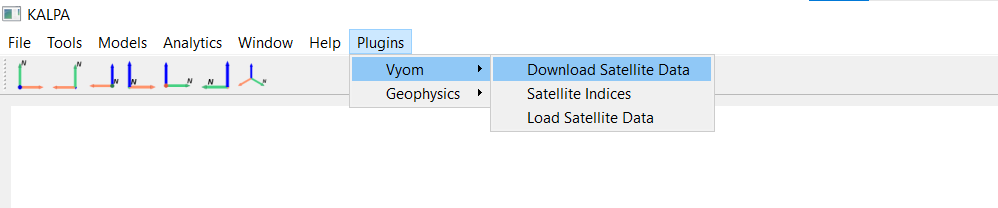
Step 2: Download Satellite Data Using Vyom#
Navigate to Plugins → Vyom → Download Satellite Data.
Select the satellite and enter the time period for which data is required.
Select the resolution and maximum percentage of cloud cover for the data to be downloaded.
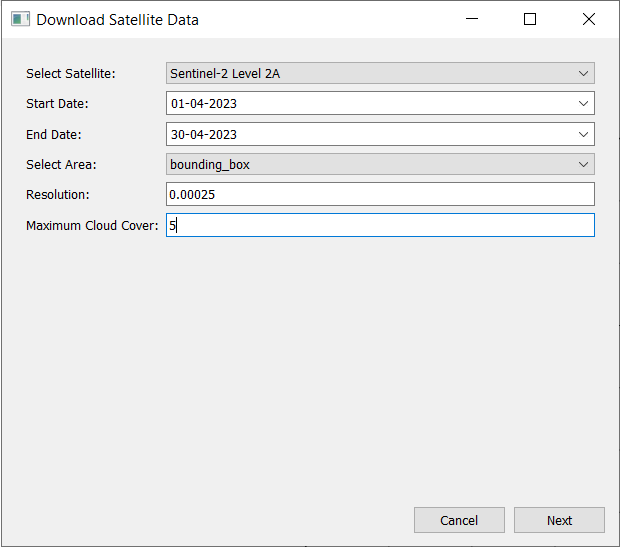
Click Next.
Choose from the available dates within the selected time period and select B04 and B08.
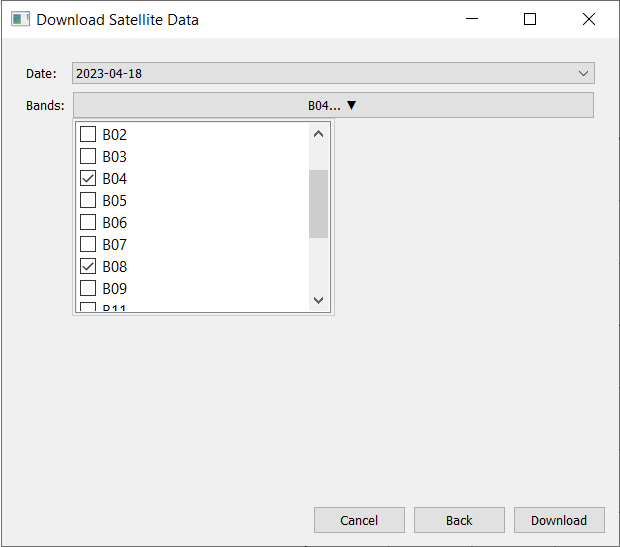
Click Download.
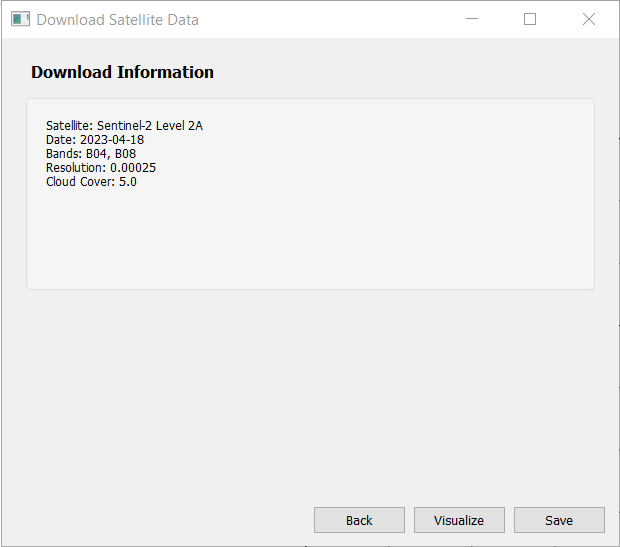
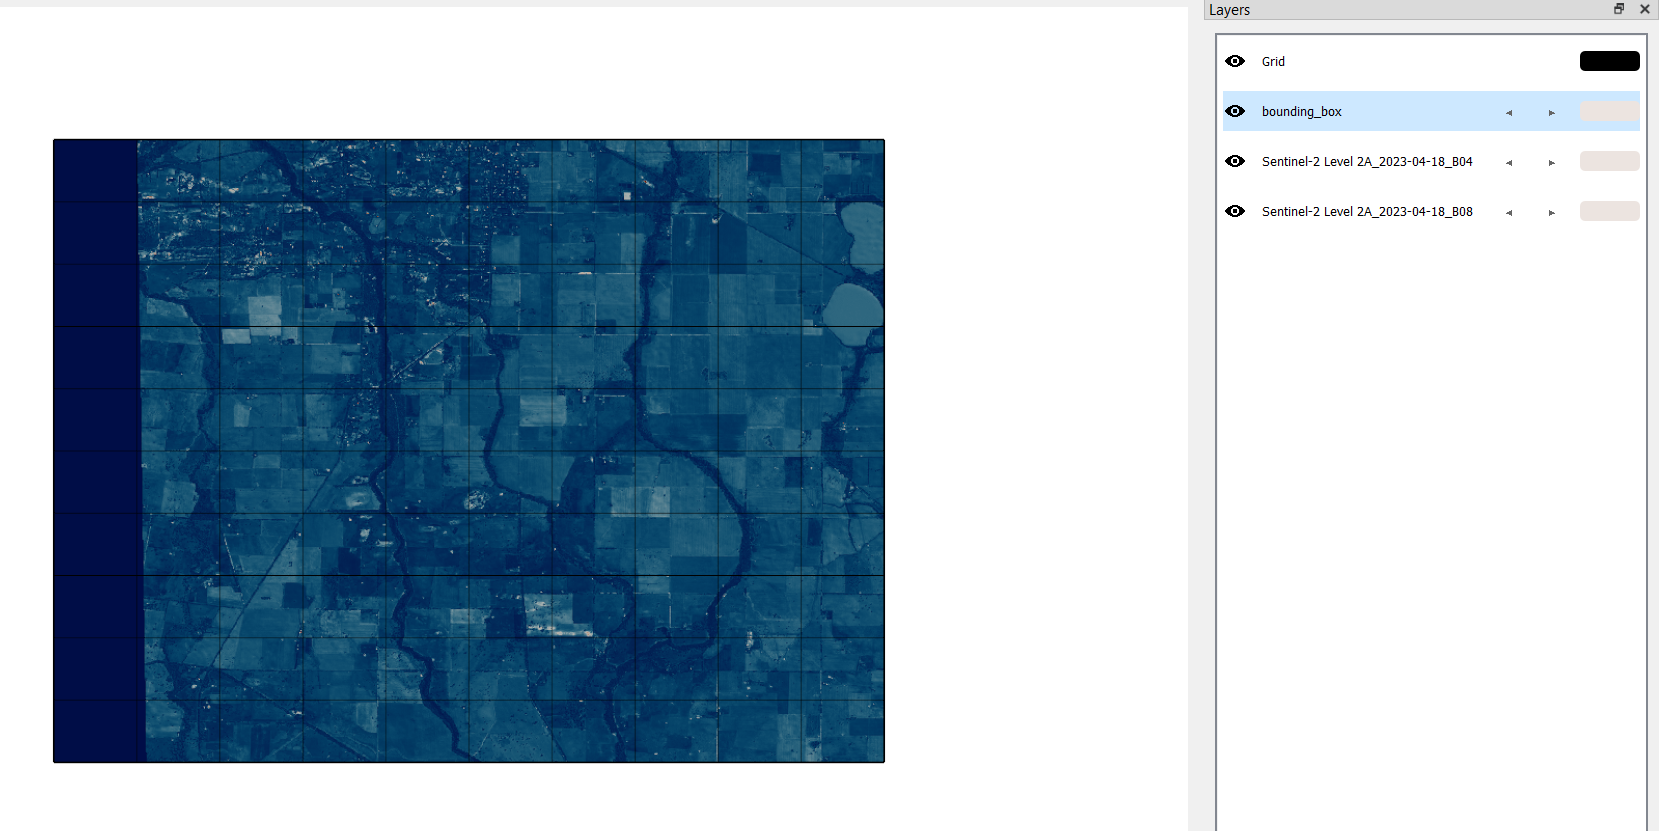
Visualize and save the satellite data.
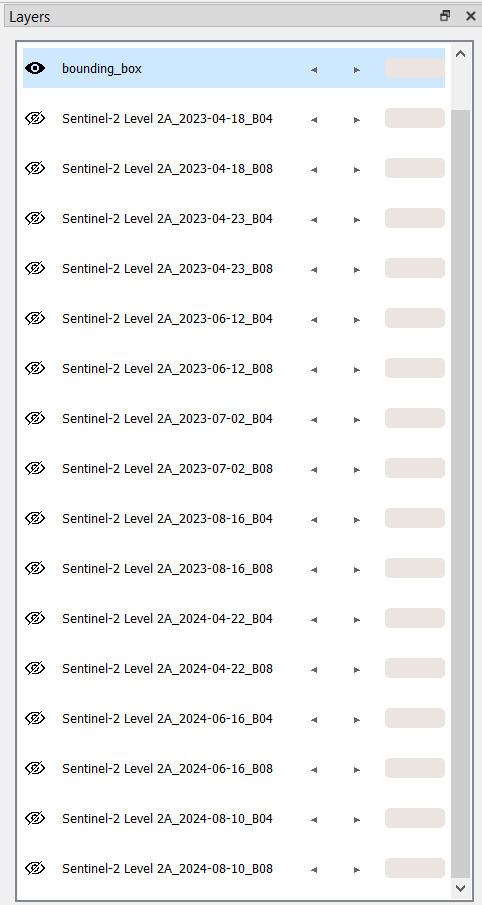
Repeat the process to download the satellite data for other months of 2023 and 2024.
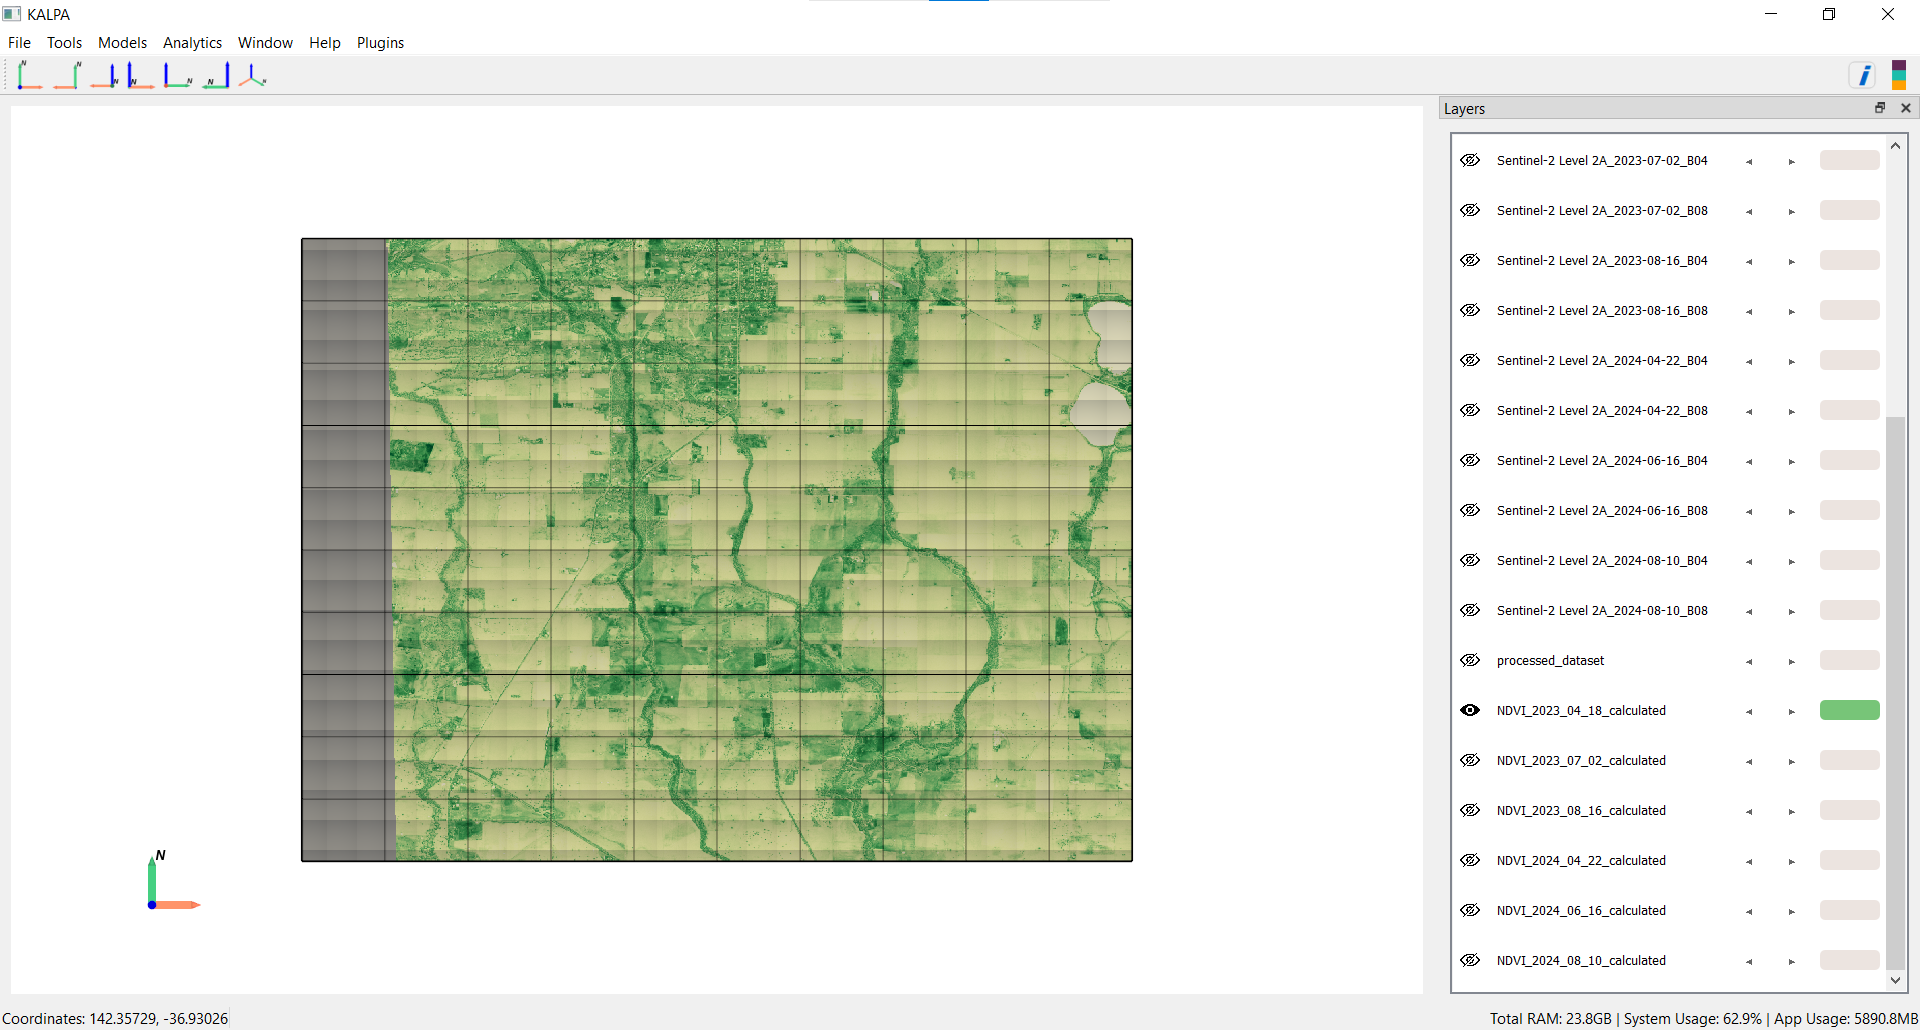
Step 3: Calculate NDVI#
Navigate to Tools → Data Sampling.
AOI (Area of Interest): Bounding Box.
Select the downloaded Sentinel-2 bands (B04 and B08) for all dates of 2023 and 2024.
Select Regular sampling method with same resolution as the satellite data.
Click Create.
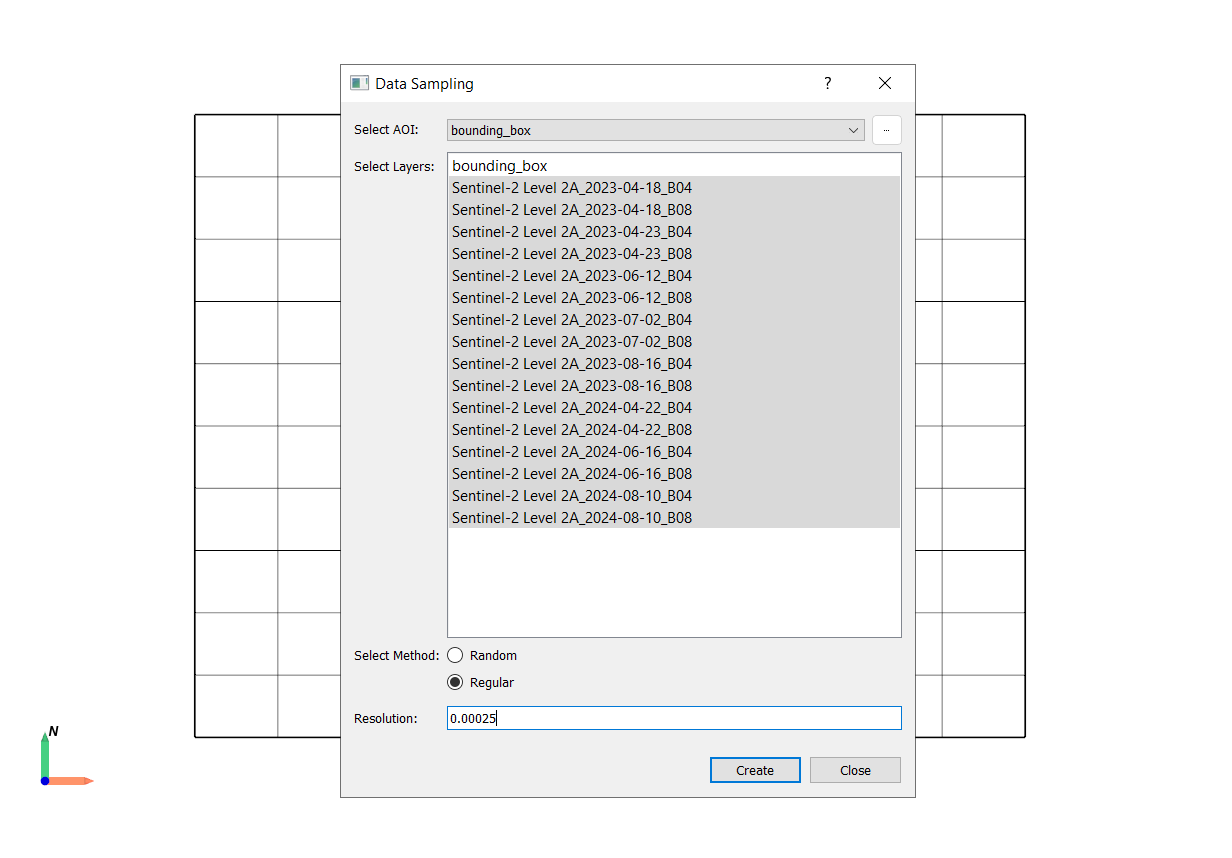
save as
processed_dataset.gpkg.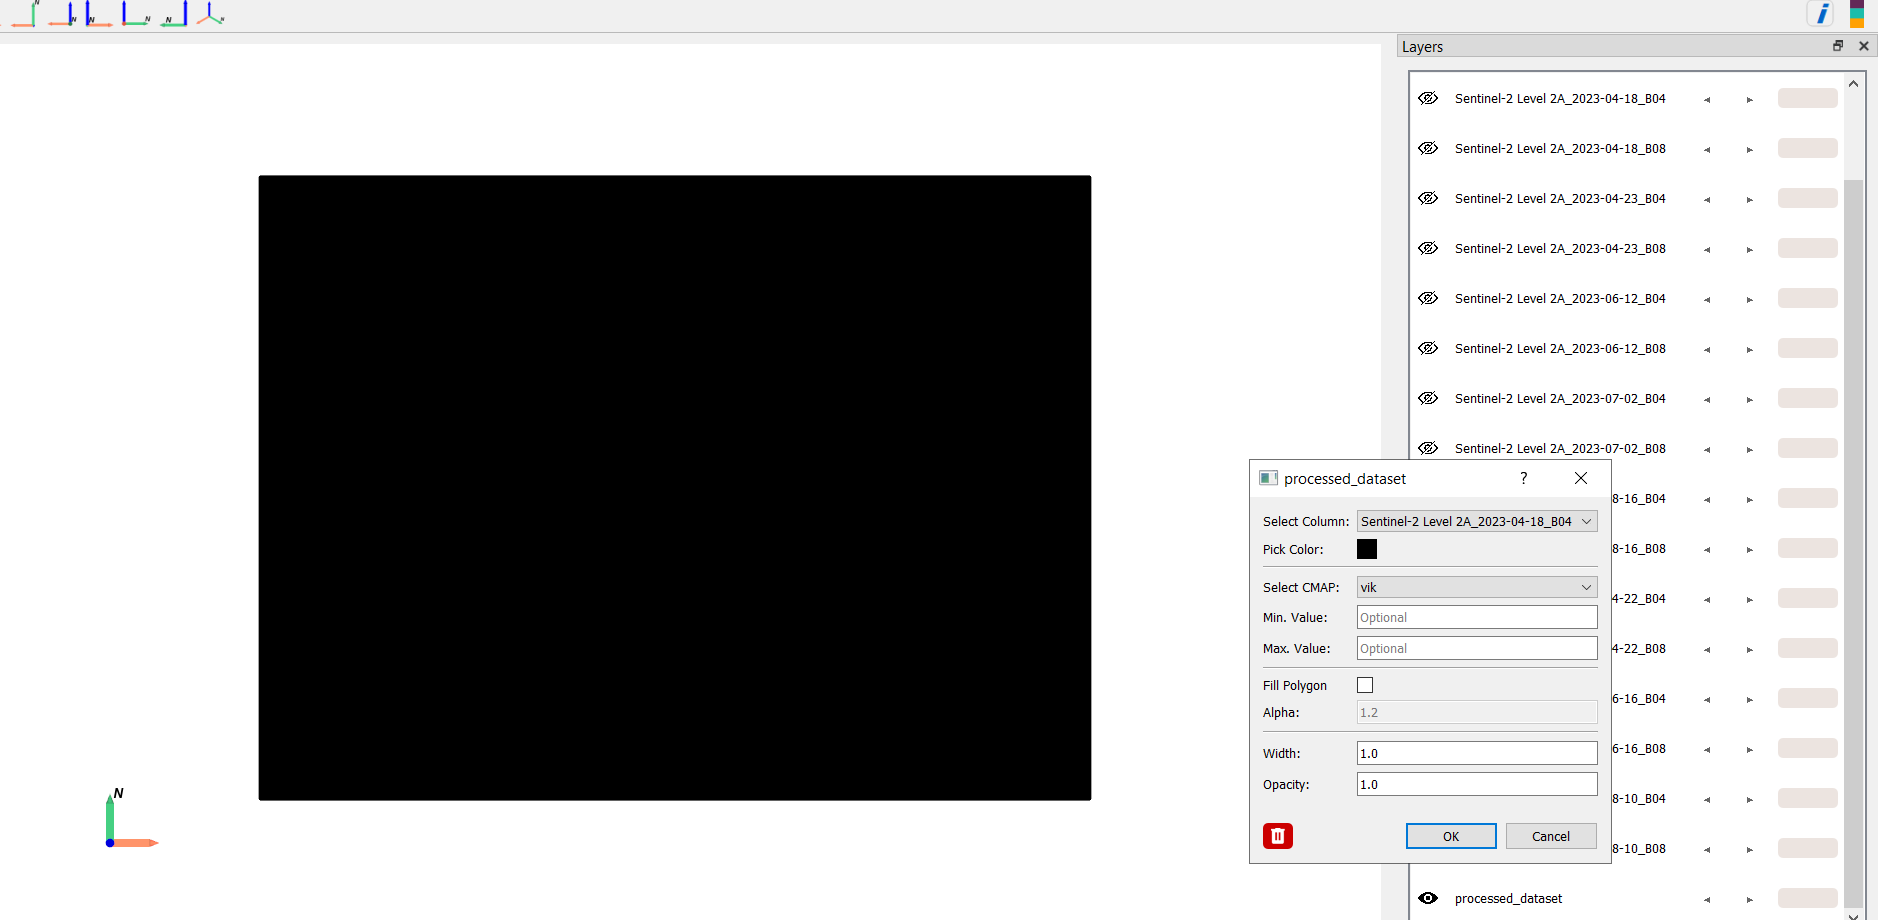
Navigate to Tools → Vector → Vector Calculator.
Select the
processed_dataset.gpkglayer.In the expression box, enter the NDVI formula with the respective band names.
Click Apply and save as
NDVI_2023_04_2018_calculated.gpkg.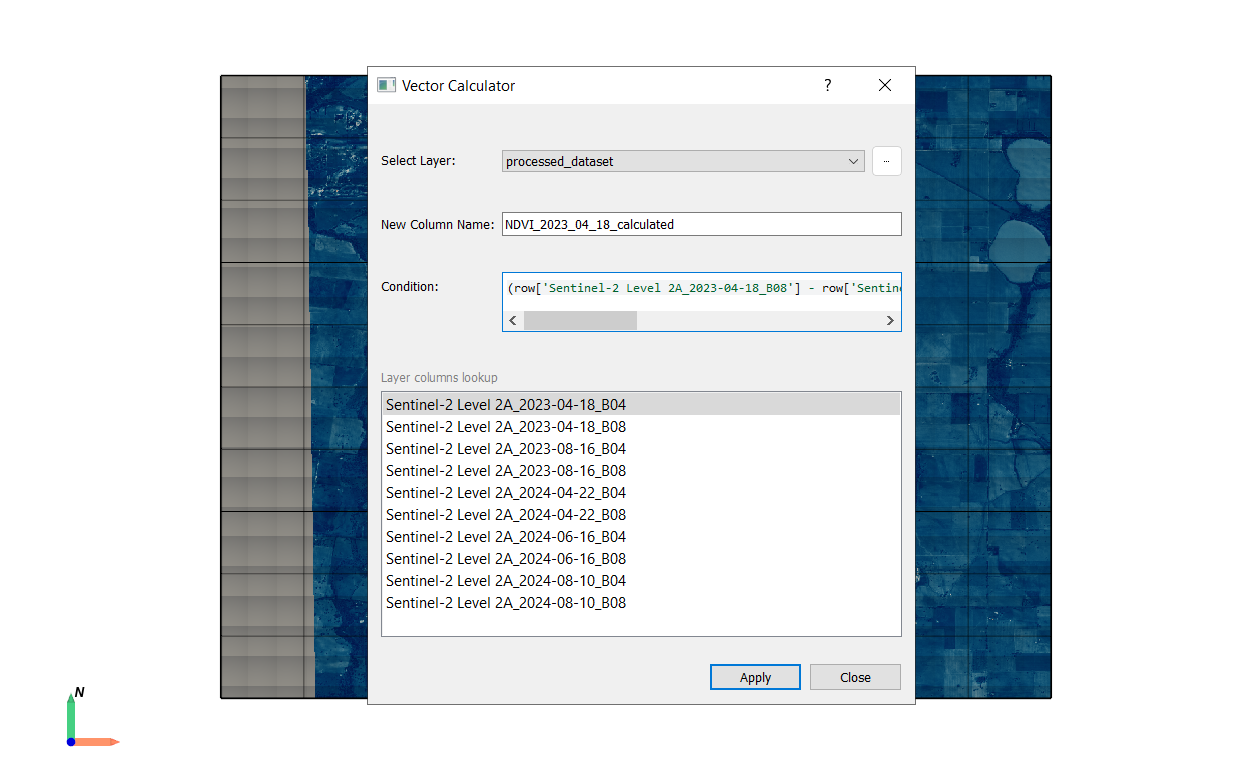
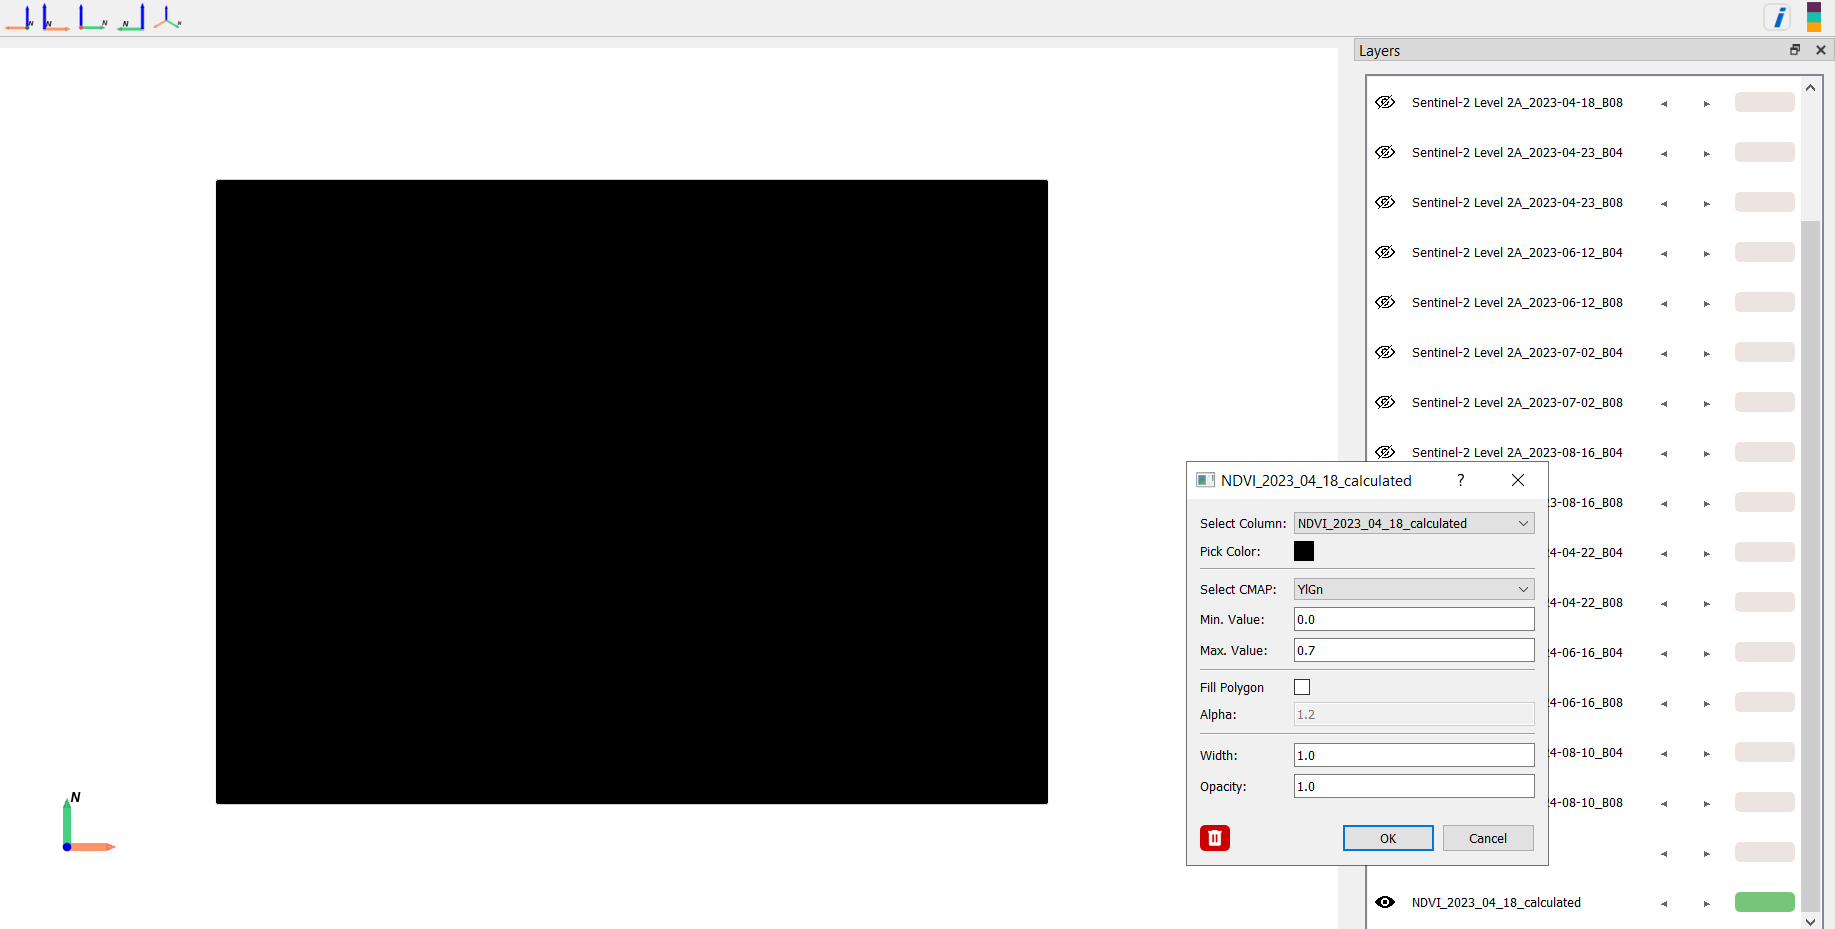
Repeat the process to calculate NDVI for other months in 2023 and 2024.
Note: The same process of calculating NDVI can also be performed using Vyom’s Satellite Indices feature, but this workflow could be useful in case of calculating other satellite indices which are not available in Vyom’s Satellite Indices feature.
Step 4: Visualize NDVI Results#
Visualize the NDVI results for different months to monitor crop health.