Tutorial 6: Mapping Floodplain Wetlands of Kosi River in Bihar#
Tutorial by
Utpal Singh¹, Satyam Pratap Singh¹
¹ School of Geosciences, University of Sydney
This tutorial demonstrates how to map floodplain wetlands of the Kosi River in Bihar using Kalpa. The process involves importing raster datasets, defining a region of interest, sampling the dataset, and applying a classification formula.
Dataset Overview#
For this task, we use: - Kosi.nc: A raster dataset representing the Kosi River floodplain.
Accessing the Dataset#
The tutorial dataset is available here.
Workflow#
Step 1: Load Raster Files#
Start by loading the required raster dataset: - Import kosi.nc as a raster layer.
Step 2: Define a Region of Interest (ROI)#
Create a bounding box to define the study area: - Generate a bounding box using the kosi.nc raster. - Save the bounding box as kosi_bb.gpkg.
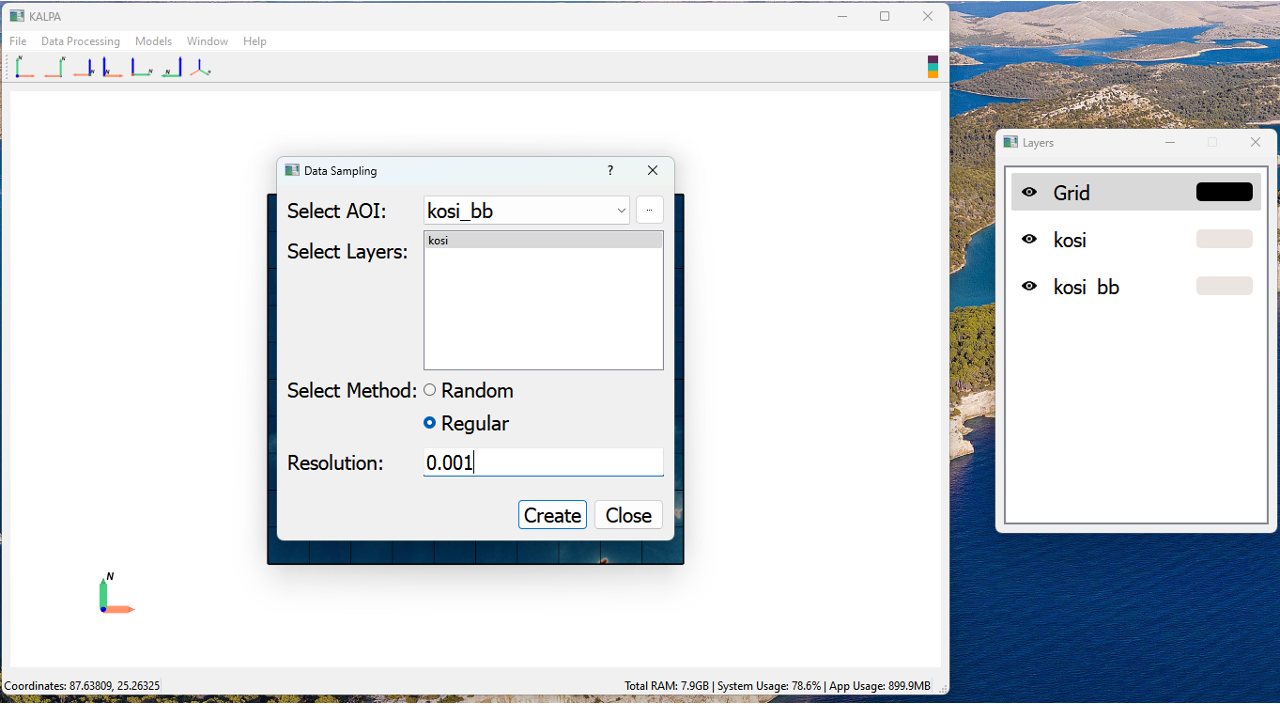
Step 3: Sample Raster Data#
Sample the raster data within the defined ROI: - Sample at a regular grid interval (0.001 degrees). - Save the sampled dataset as kosi_sampled.gpkg.
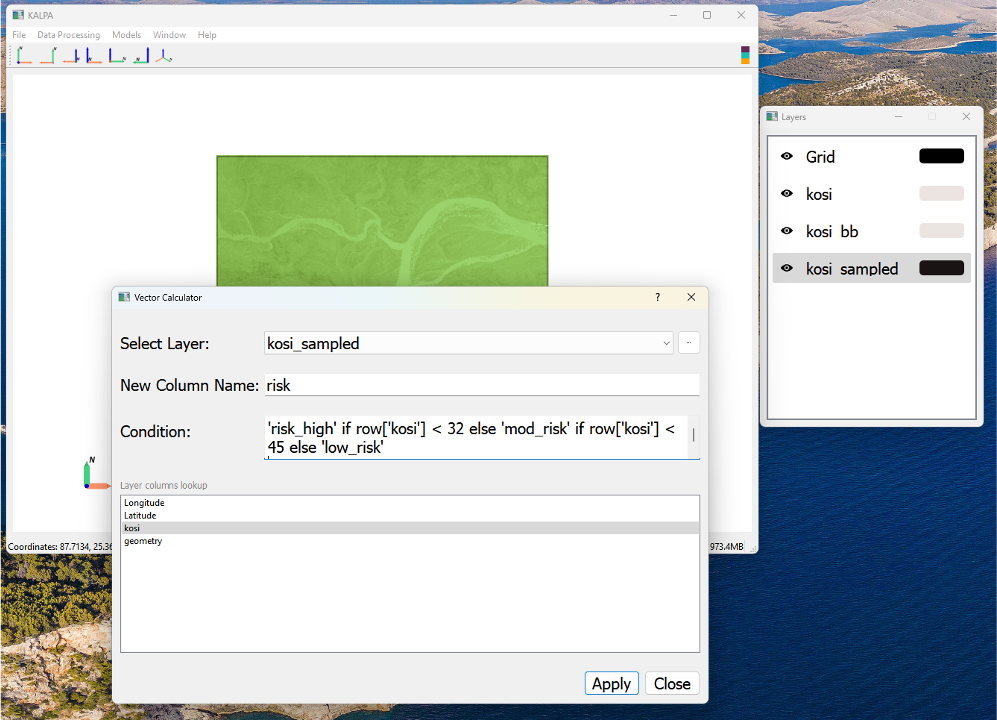
Step 4: Compute Floodplain Risk Index#
Enter the following classification formula in Kalpa:
Apply the formula to classify floodplain risk levels.
Save the result as risk_calculated.gpkg.
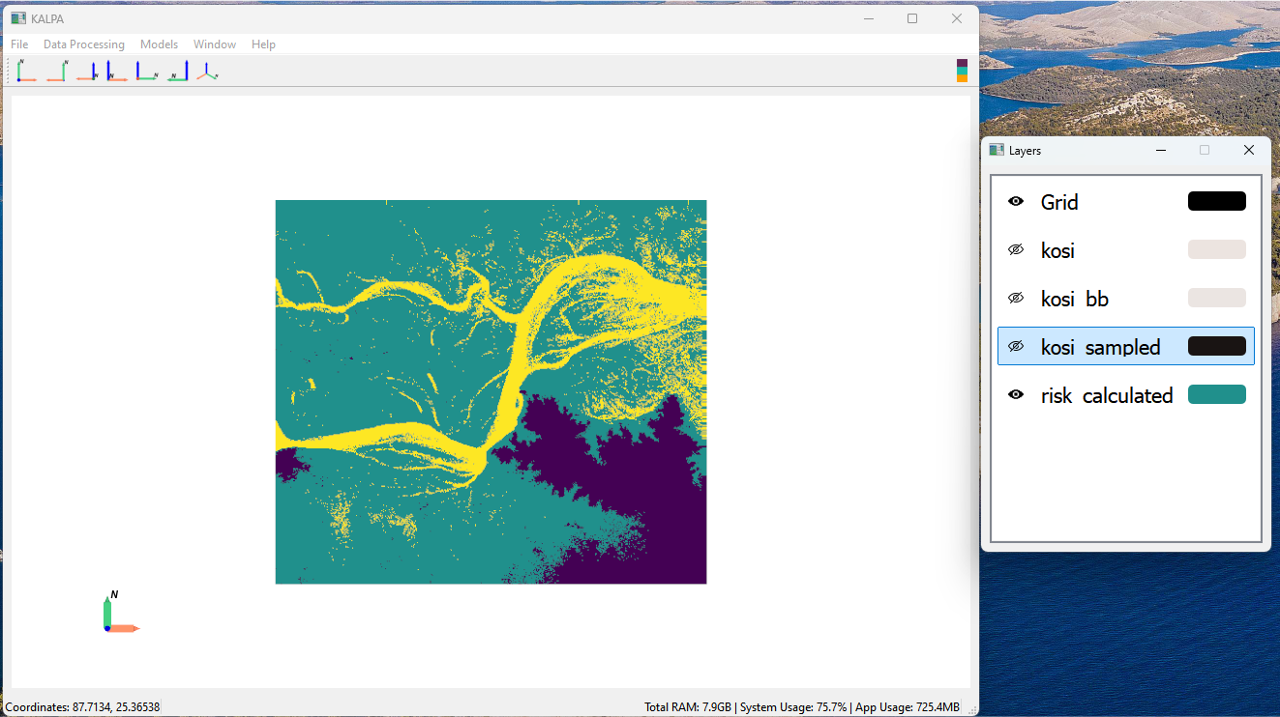
Step 5: Visualize Results#
Open the classified floodplain risk map in Kalpa.
Adjust the color maps to enhance visualization.
Analyze the spatial distribution of wetland flood risk.
Enjoy!!!