Data Plotting and Analytics#
Kalpa provides a comprehensive data plotting and analytics tool that allows users to create various types of plots and charts to analyze and interpret vector data. This section covers the features and usage of the Analytics Plotter within Kalpa.
Function Overview#
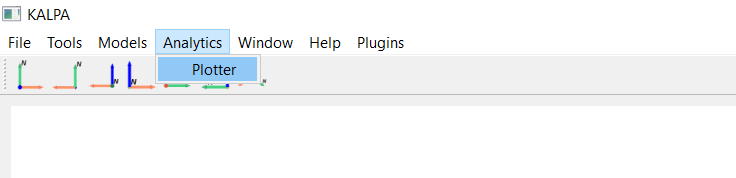
To access the Plotter, navigate to Analytics > Plotter from the menu bar. This will open the Plotter window.
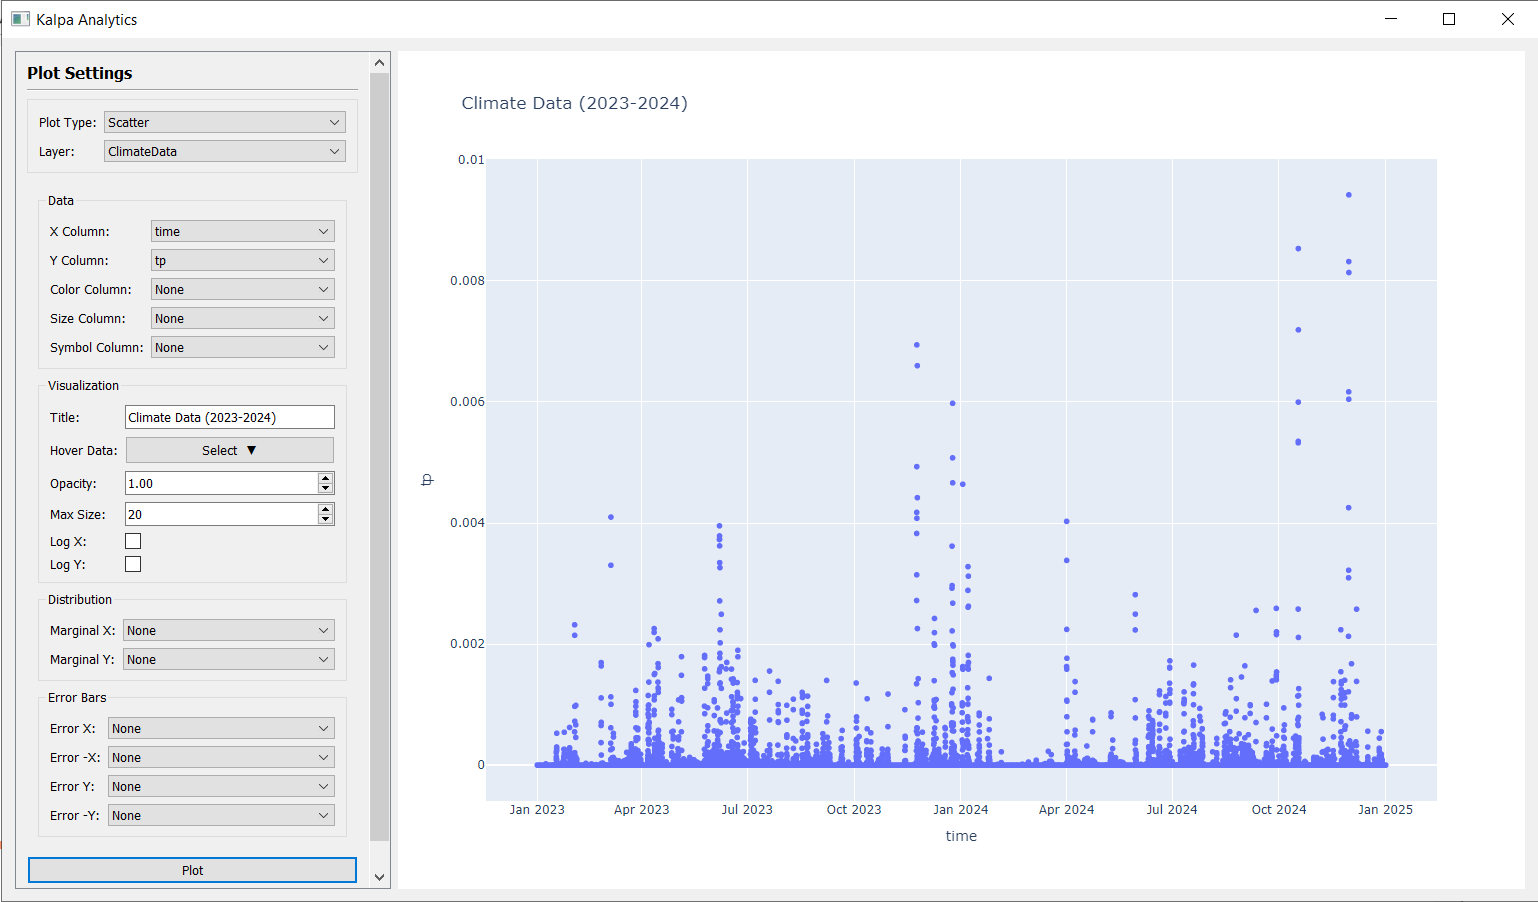
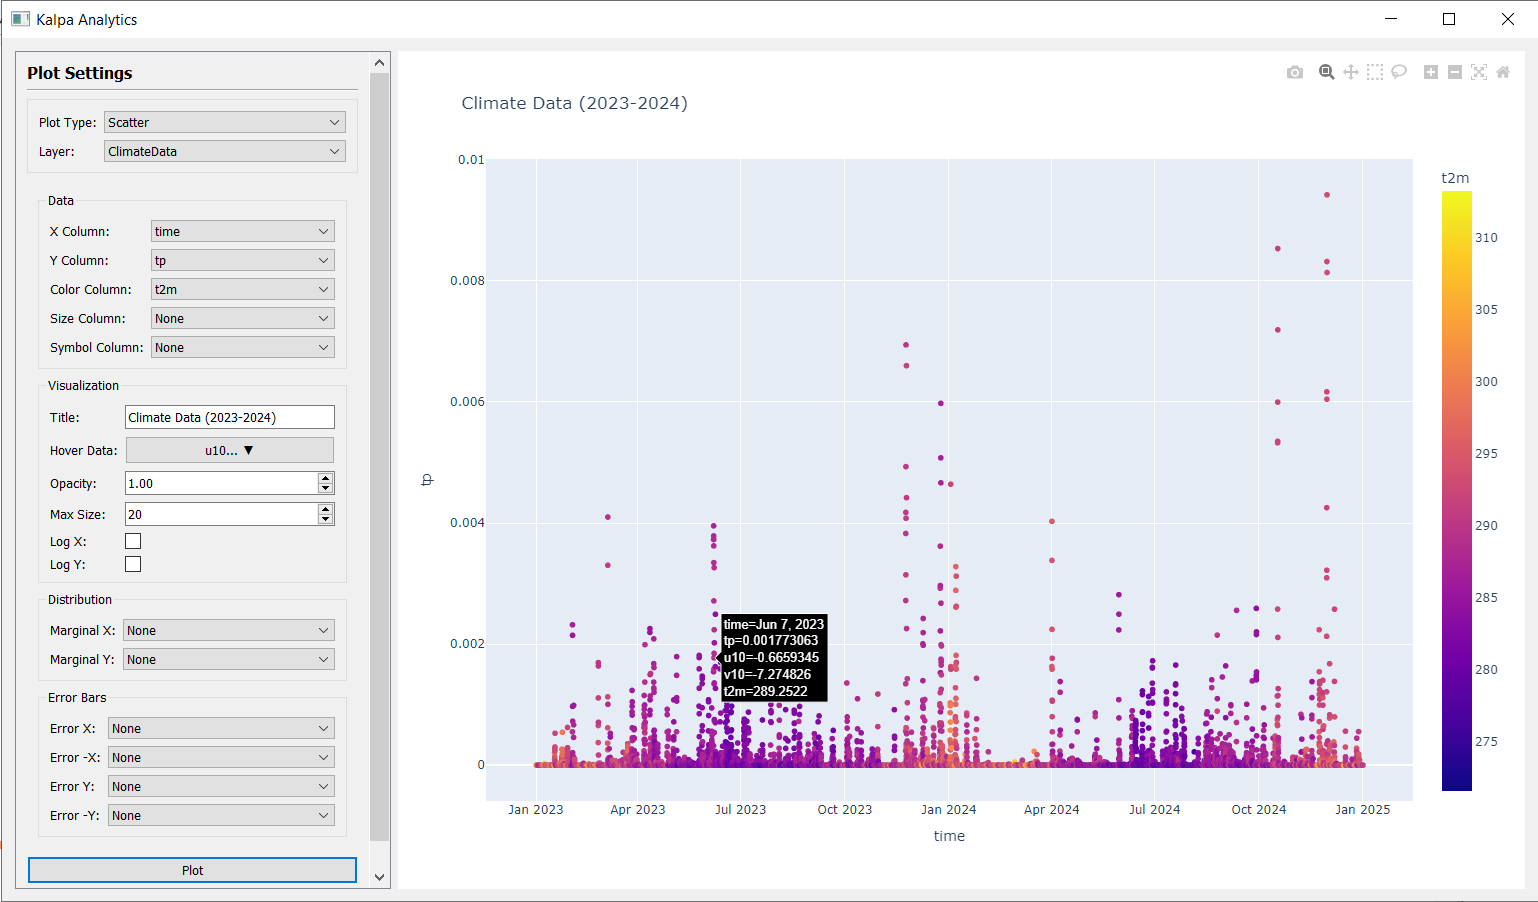
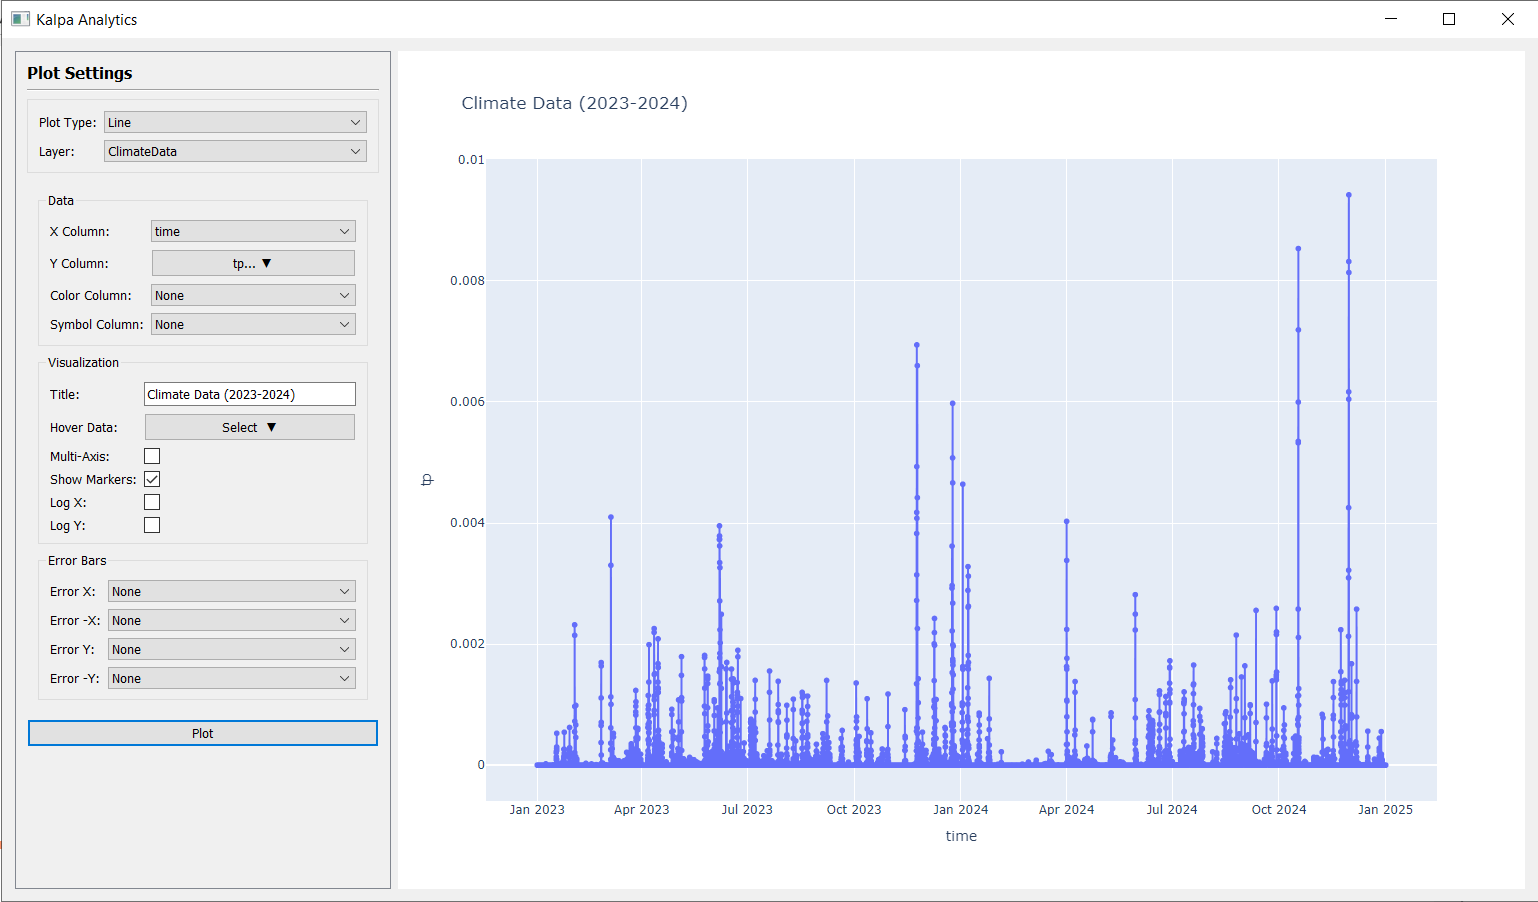
Select the plot type (Line or scatter) from the dropdown menu.
This will enable the relevant options for configuring the plot.
Choose the layer from the loaded vector layers in the Layer Panel.
Select the X and Y axes by choosing the appropriate columns from the selected vector layer.
Customize the plot by adding titles, labels, and adjusting visual settings such as colors and markers.
Click Plot to generate the visualization.
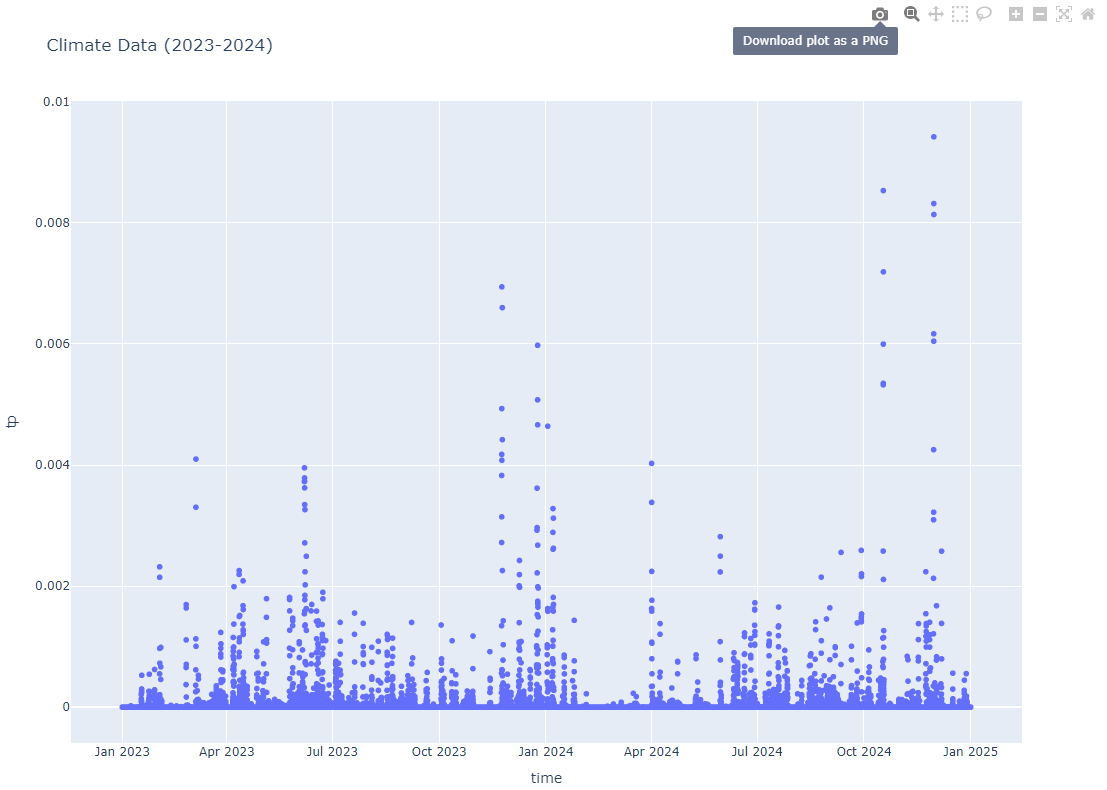
You can hover over data points in the plot to see detailed information about each point.
Download the generated plot as an image file using the Download plot as a PNG button on the top right corner of the plot window.
Customizations#
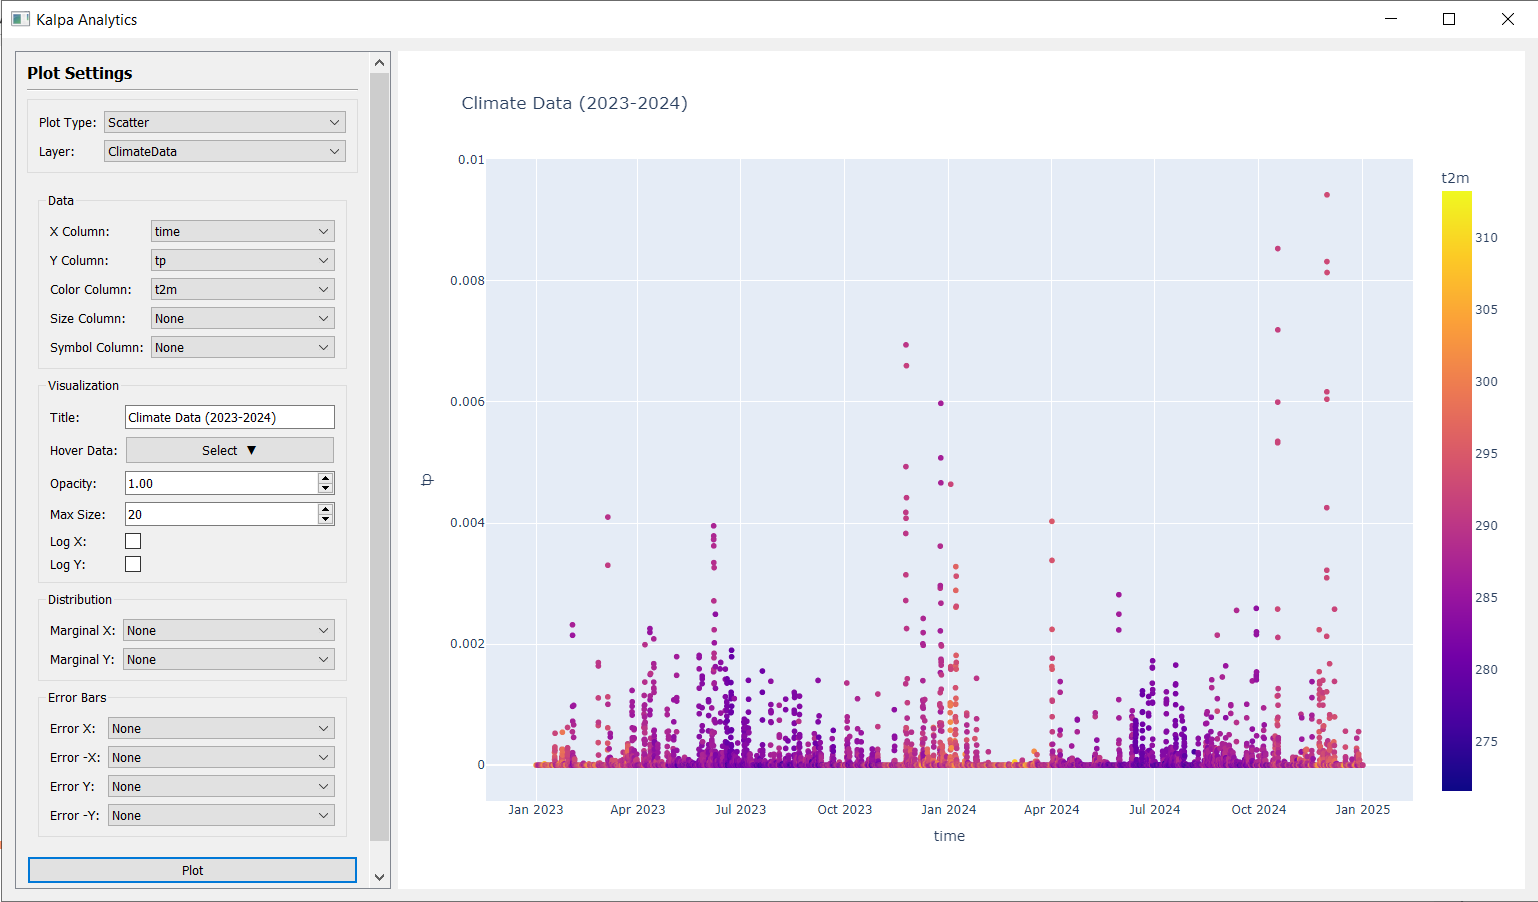
Color Column: Choose a column from the vector layer to color the data points based on values of the selected column. This is particularly useful to visualize variations in data.
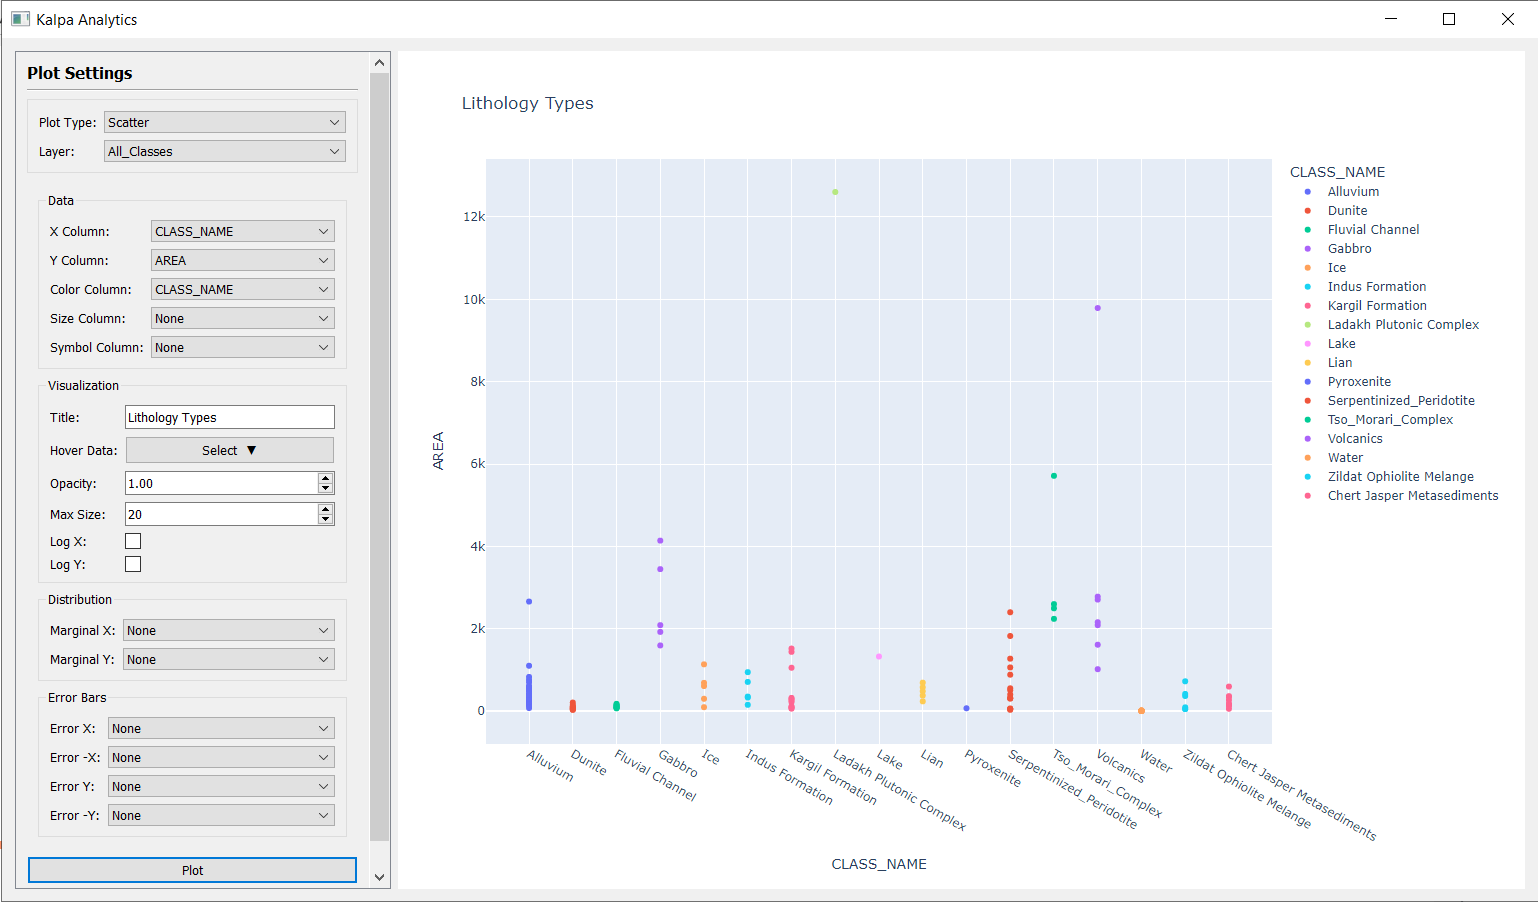
Size Column: This option allows you to adjust the size of data points based on the values in a selected column, providing an additional dimension of data representation. Numerical values determine the size of each point. (Scatter plots)
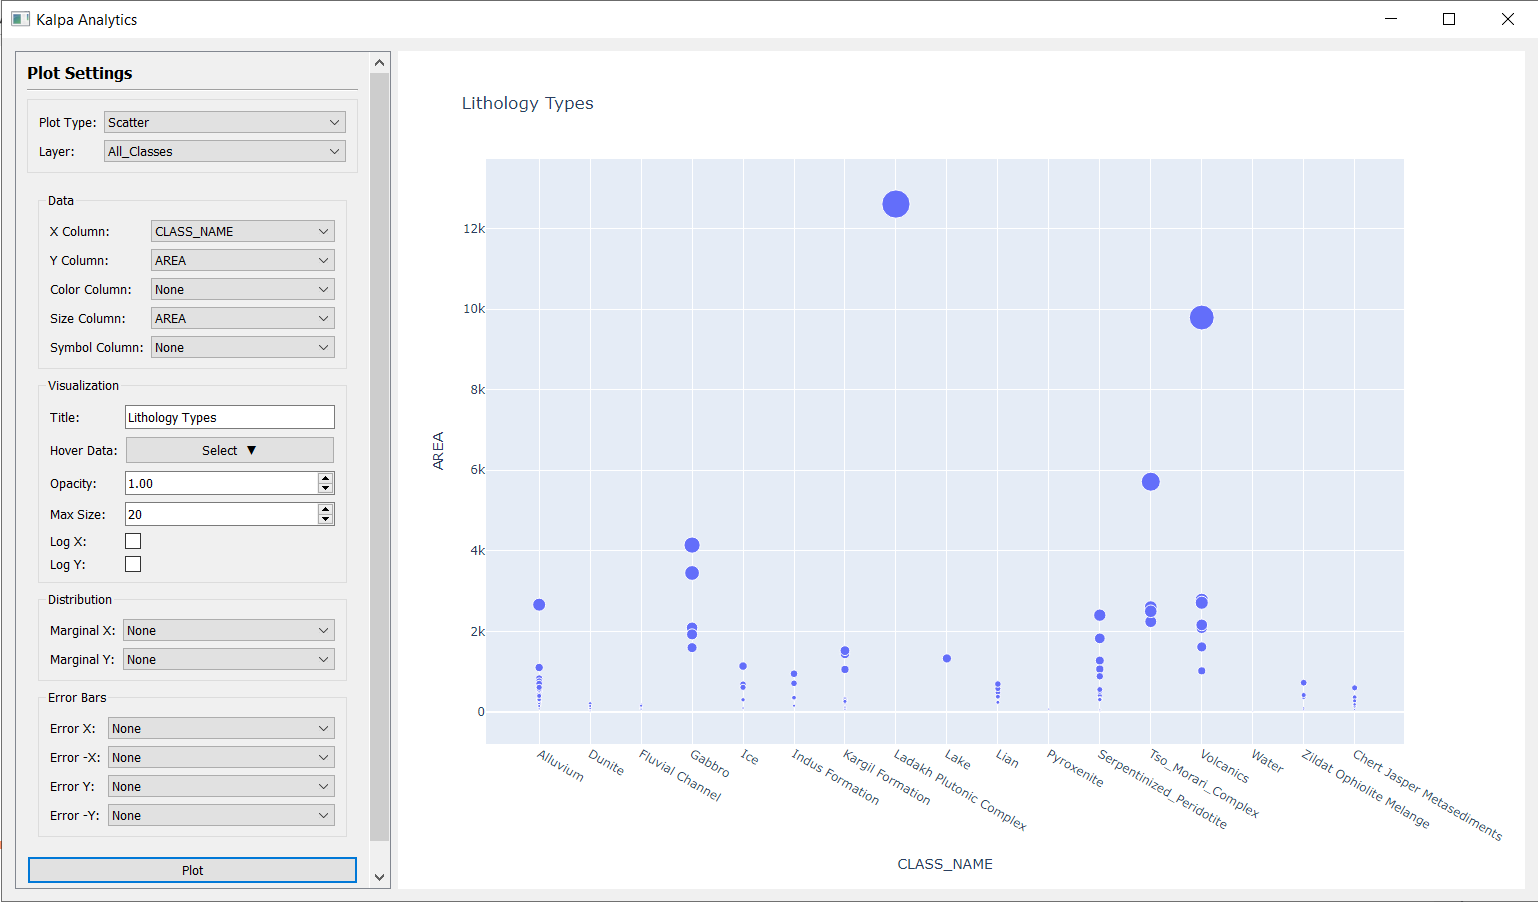
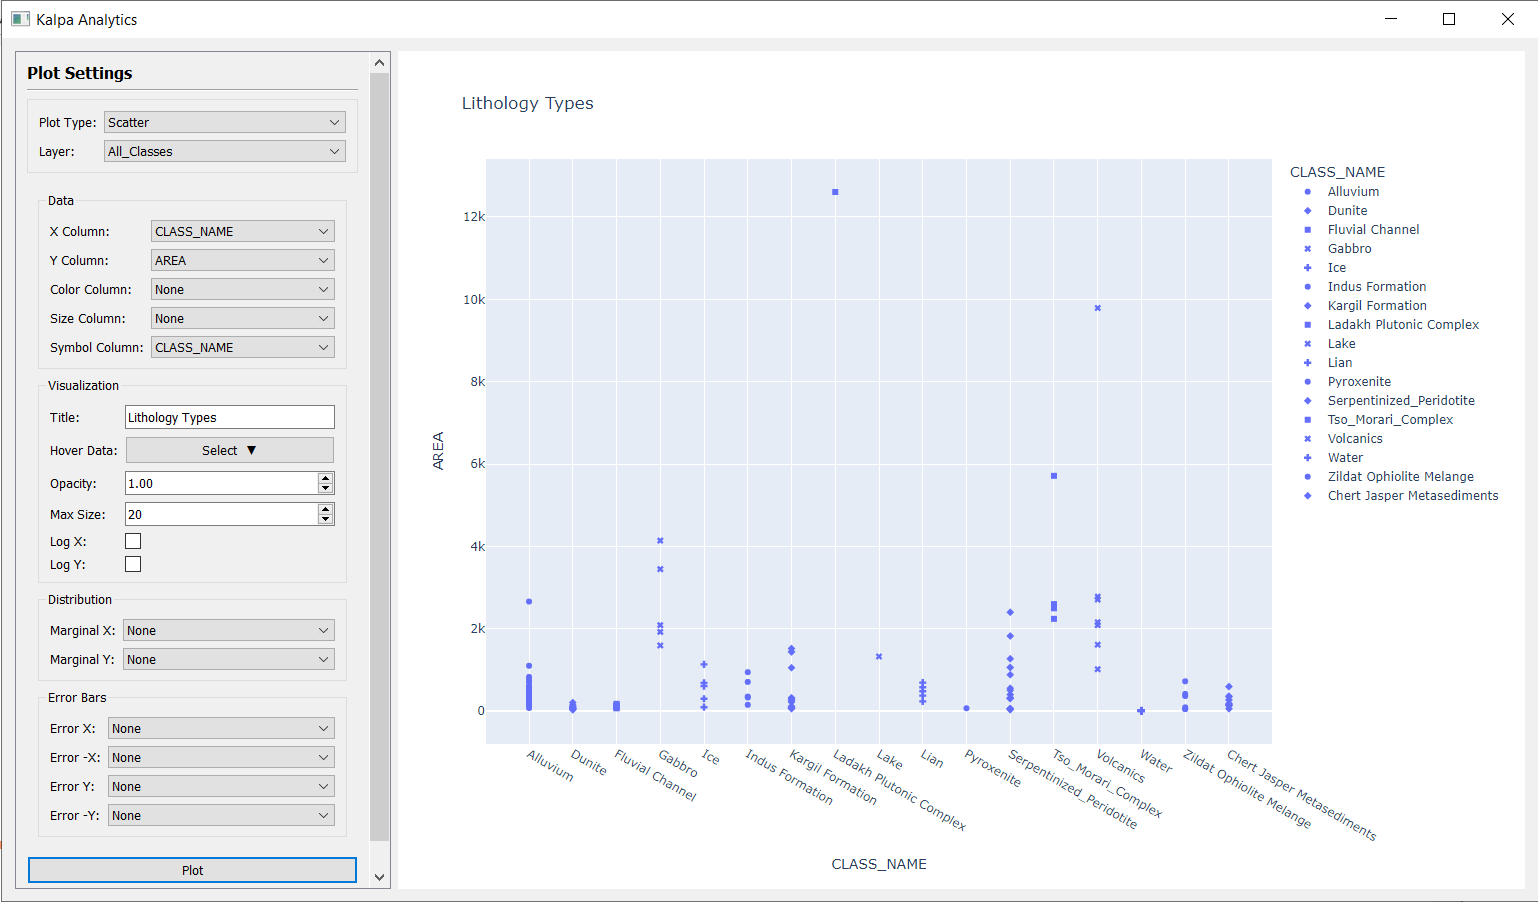
Symbol Column: Useful in case of categorical data. This option allows you to assign different symbols/shapes to data points based on the categories in the selected column.
Hover Data: Select additional columns to display more information when hovering over data points in the plot.
Log X/Log Y: Enable logarithmic scaling for the X or Y axes to better visualize data that spans several orders of magnitude.
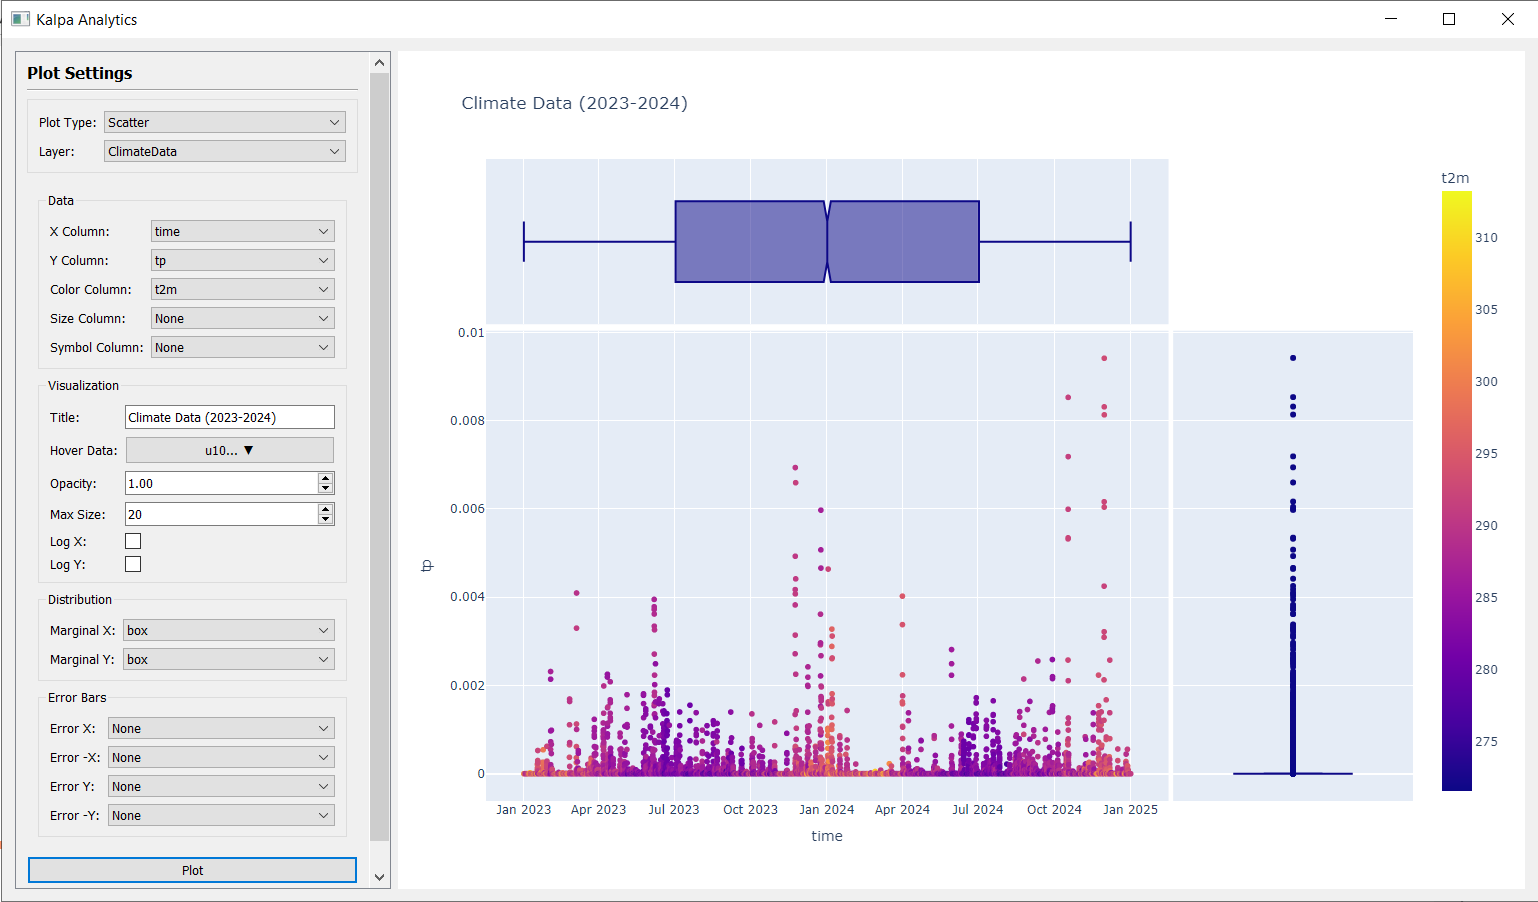
Distribution Plot: Following distribution plots are available: (Scatter plots)
Histogram: Create histograms to visualize the distribution of data points along a single axis.
Box Plot: Generate box plots to summarize the distribution of data through their quartiles.
Violin Plot: Create violin plots to visualize the distribution and probability density of the data.
Rug Plot: Add rug plots to display individual data points along an axis.
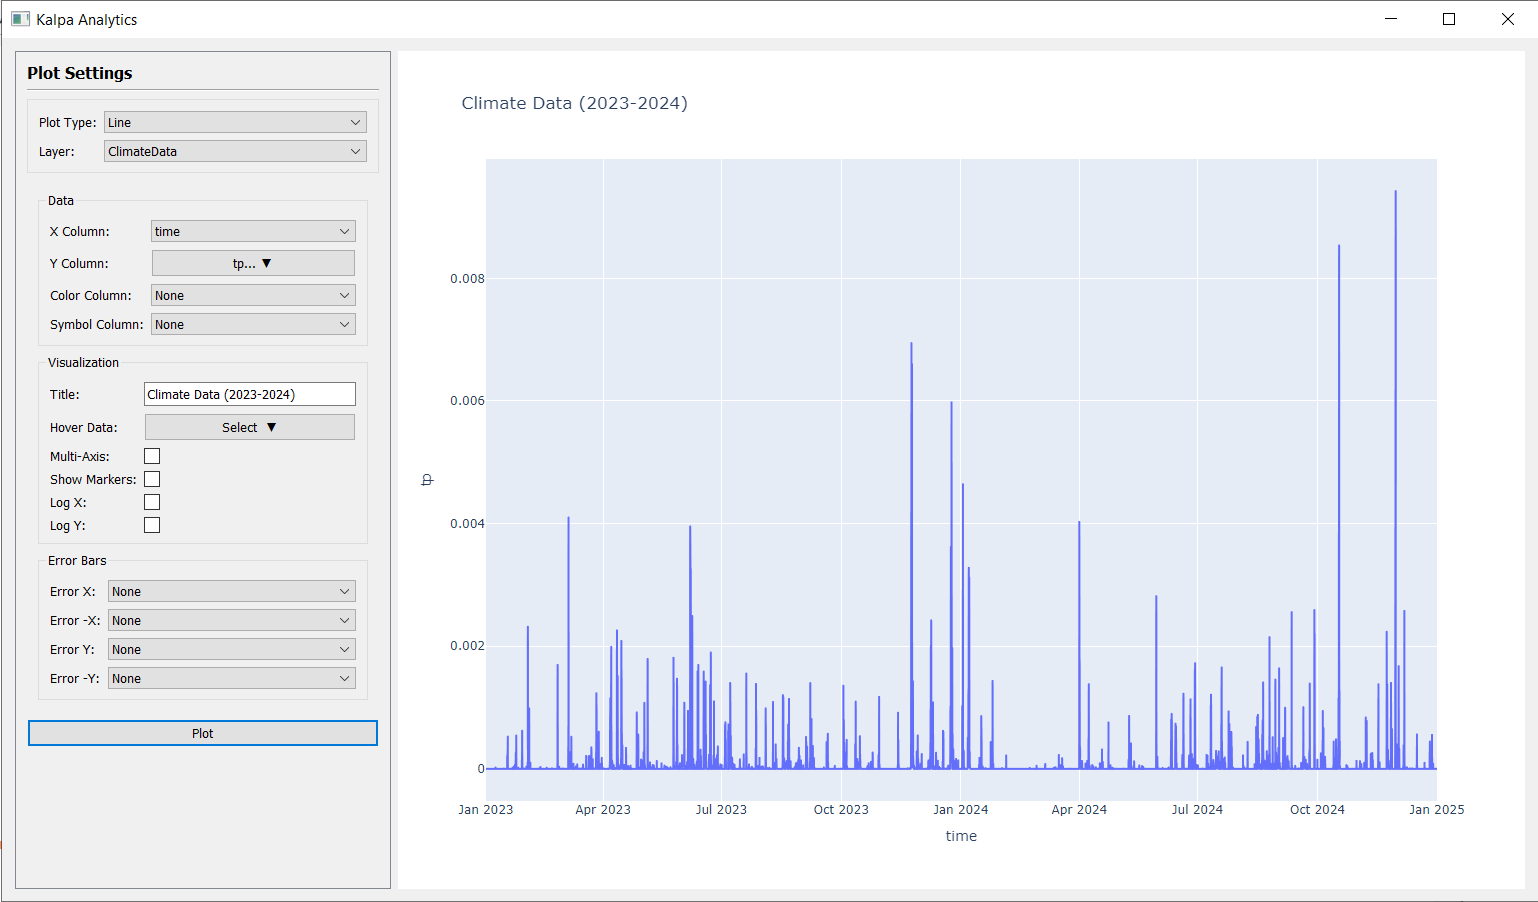
Show Markers: Toggle the visibility of markers on the plot. (Line plots)
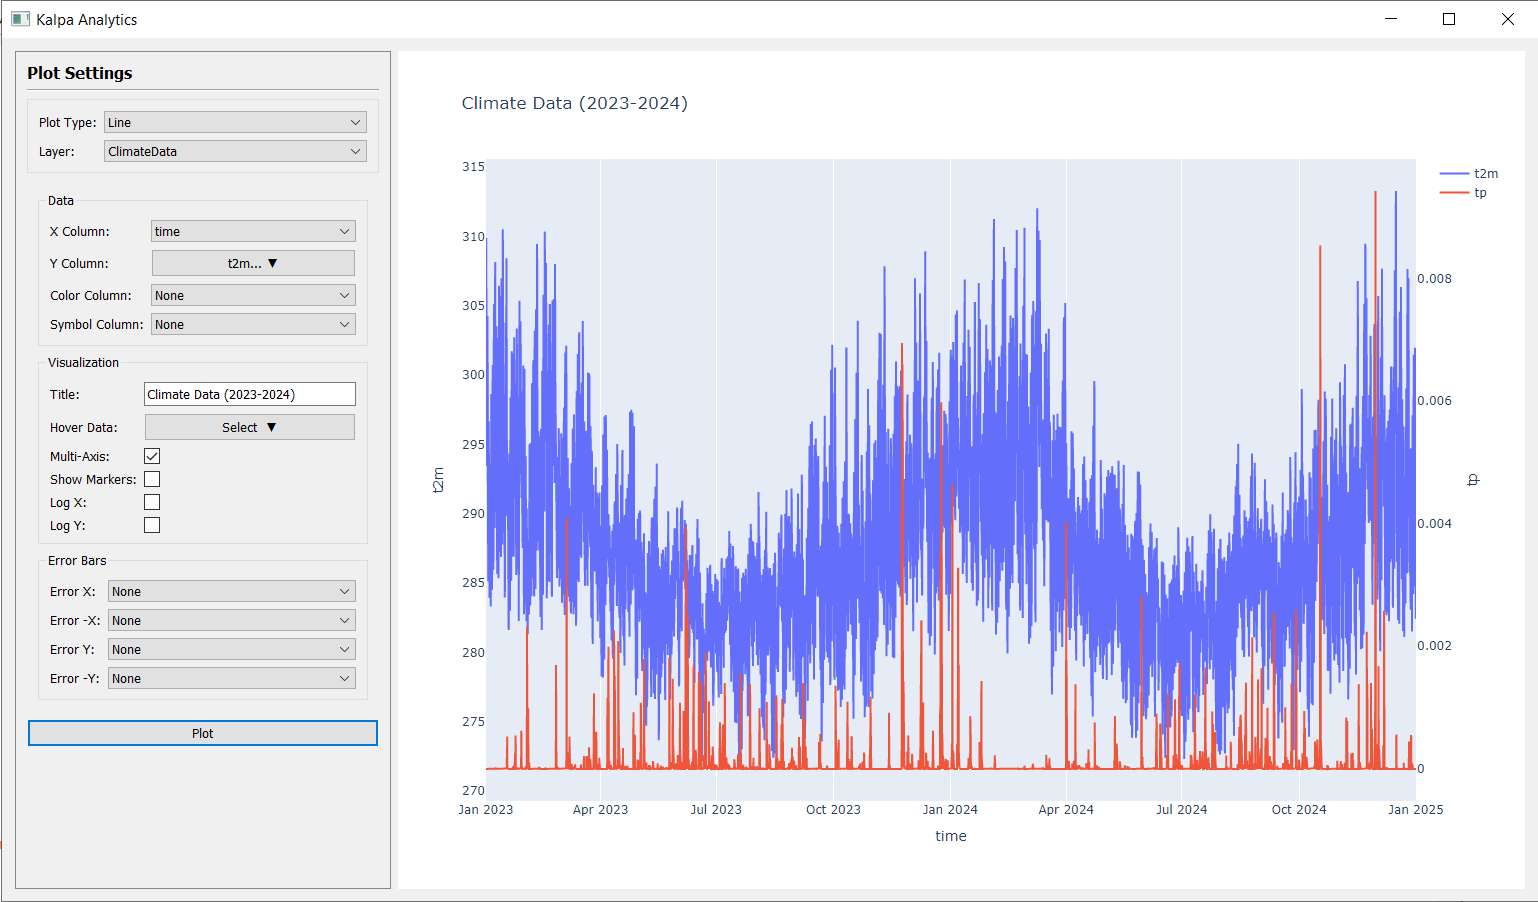
Multi-Axis: Check this to plot multiple columns together on Y-axis. (Line plots)
Error Bars: Select any columns having error data for X and Y axes to add error bars to the plot.